This lesson unit is intended to help assess how well students are …
This lesson unit is intended to help assess how well students are able to interpret and use scale drawings to plan a garden layout. This involves using proportional reasoning and metric units.
Students will be using real-life energy use data to learn how to …
Students will be using real-life energy use data to learn how to use spreadsheets and create graphs to better organize and view data. Discussions can then follow to analyze the data and explain the usage. Real rates are then provided, and students can use the electricity consumed data to create a utility bill for the consumer and compare the standard Residential Service charges to if the member were instead billed by the “Time of Use” rate.
This lesson unit is intended to help you assess how well students …
This lesson unit is intended to help you assess how well students are able to: solve simple problems involving ratio and direct proportion; choose an appropriate sampling method; and collect discrete data and record them using a frequency table.
This lesson unit is intended to help teachers assess how well students …
This lesson unit is intended to help teachers assess how well students are able to interpret percent increase and decrease, and in particular, to identify and help students who have the following difficulties: translating between percents, decimals, and fractions; representing percent increase and decrease as multiplication; and recognizing the relationship between increases and decreases.
In this activity, students gain first-hand experience with the mechanical advantage of …
In this activity, students gain first-hand experience with the mechanical advantage of pulleys. Students are given the challenge of helping save a whale by moving it from an aquarium back to its natural habitat into the ocean. They set up different pulley systems, compare the theoretical and actual mechanical advantage of each and discuss their recommendations as a class.
Four full-year digital course, built from the ground up and fully-aligned to …
Four full-year digital course, built from the ground up and fully-aligned to the Common Core State Standards, for 7th grade Mathematics. Created using research-based approaches to teaching and learning, the Open Access Common Core Course for Mathematics is designed with student-centered learning in mind, including activities for students to develop valuable 21st century skills and academic mindset.
Getting Started Type of Unit: Introduction Prior Knowledge Students should be able …
Getting Started
Type of Unit: Introduction
Prior Knowledge
Students should be able to:
Understand ratio concepts and use ratios. Use ratio and rate reasoning to solve real-world problems. Identify and use the multiplication property of equality.
Lesson Flow
This unit introduces students to the routines that build a successful classroom math community, and it introduces the basic features of the digital course that students will use throughout the year.
An introductory card sort activity matches students with their partner for the week. Then over the course of the week, students learn about the routines of Opening, Work Time, Ways of Thinking, Apply the Learning (some lessons), Summary of the Math, Reflection, and Exercises. Students learn how to present their work to the class, the importance of students’ taking responsibility for their own learning, and how to effectively participate in the classroom math community.
Students then work on Gallery problems, to further explore the resources and tools and to learn how to organize their work.
The mathematical work of the unit focuses on ratios and rates, including card sort activities in which students identify equivalent ratios and match different representations of an equivalent ratio. Students use the multiplication property of equality to justify solutions to real-world ratio problems.
Review the multiplication property of equality. Demonstrate the use of “ask myself” …
Review the multiplication property of equality. Demonstrate the use of “ask myself” questions to understand a problem before solving it. Have students discuss the strategies that they can use when they feel stuck on a problem. Direct partners to solve a problem using a ratio table and equations, and then justify their solution in a presentation using the multiplication property of equality. Have each student write a Summary of the Mathematics in the lesson and work together to create a classroom summary.Key ConceptsStudents use the multiplication property of equality to justify their solution to a ratio problem.Goals and Learning ObjectivesBefore starting to work on a problem, make sense of the problem by using “ask myself” questions.Persevere in solving a problem even when feeling stuck.Solve a ratio problem using two different strategies.Link arithmetic and algebraic methods to solve a ratio problem.Use the multiplication property of equality to solve ratio problems
Proportional Relationships Type of Unit: Concept Prior Knowledge Students should be able …
Proportional Relationships
Type of Unit: Concept
Prior Knowledge
Students should be able to:
Understand what a rate and ratio are. Make a ratio table. Make a graph using values from a ratio table.
Lesson Flow
Students start the unit by predicting what will happen in certain situations. They intuitively discover they can predict the situations that are proportional and might have a hard time predicting the ones that are not. In Lessons 2–4, students use the same three situations to explore proportional relationships. Two of the relationships are proportional and one is not. They look at these situations in tables, equations, and graphs. After Lesson 4, students realize a proportional relationship is represented on a graph as a straight line that passes through the origin. In Lesson 5, they look at straight lines that do not represent a proportional relationship. Lesson 6 focuses on the idea of how a proportion that they solved in sixth grade relates to a proportional relationship. They follow that by looking at rates expressed as fractions, finding the unit rate (the constant of proportionality), and then using the constant of proportionality to solve a problem. In Lesson 8, students fine-tune their definition of proportional relationship by looking at situations and determining if they represent proportional relationships and justifying their reasoning. They then apply what they have learned to a situation about flags and stars and extend that thinking to comparing two prices—examining the equations and the graphs. The Putting It Together lesson has them solve two problems and then critique other student work.
Gallery 1 provides students with additional proportional relationship problems.
The second part of the unit works with percents. First, percents are tied to proportional relationships, and then students examine percent situations as formulas, graphs, and tables. They then move to a new context—salary increase—and see the similarities with sales taxes. Next, students explore percent decrease, and then they analyze inaccurate statements involving percents, explaining why the statements are incorrect. Students end this sequence of lessons with a formative assessment that focuses on percent increase and percent decrease and ties it to decimals.
Students have ample opportunities to check, deepen, and apply their understanding of proportional relationships, including percents, with the selection of problems in Gallery 2.
Students connect percent to proportional relationships in the context of sales tax.Key …
Students connect percent to proportional relationships in the context of sales tax.Key ConceptsWhen there is a constant tax percent, the total cost for items purchase—including the price and the tax—is proportional to the price.To find the cost, c , multiply the price of the item, p, by (1 + t), where t is the tax percent, written as a decimal: c = p(1 + t).The constant of proportionality is (1 + t) because of the structure of the situation:c = p + tp = p(1 + t).Because of the distributive property, multiplying the price by (1 + t) means multiplying the price by 1, then multiplying the price by t, and then taking the sum of these products.Goals and Learning ObjectivesFind the total cost in a sales tax situation.Understand that a proportional relationship only exists between the price of an item and the total cost of the item if the sales tax is constant.Find the constant of proportionality in a sales tax situation.Make a graph of an equation showing the relationship between the price of an item and the total amount paid.
Students create equations, tables, and graphs to show the proportional relationships in …
Students create equations, tables, and graphs to show the proportional relationships in sales tax situations.Key ConceptsThe quantities—price, tax, and total cost—can each be known or unknown in a given situation, but if you know two quantities, you can figure out the missing quantity using the structure of the relationship among them.If either the price or the total cost are unknown, you can write an equation of the form y = kx, with k as the known value (1 + tax), and solve for x or y.If the tax is the unknown value, you can write an equation of the form y = kx and solve for k, and then subtract 1 from this value to find the tax (as a decimal value).Building a general model for the relationship among all three quantities helps you sort out what you know and what you need to find out.Goals and Learning ObjectivesMake a table to organize known and unknown quantities in a sales tax problem.Write and solve an equation to find an unknown quantity in a sales tax problem.Make a graph to represent a table of values.Determine the unknown amount—either the price of an item, the amount of the sales tax, or the total cost—in a sales tax situation when given the other two amounts.
Students are given a collection of statements that are incorrect. Their task …
Students are given a collection of statements that are incorrect. Their task is to construct arguments about why the statements are flawed and then correct the flawed statements.Key ConceptsPercent change is a rate of change of an original amount.In two situations with the same percent change but different original amounts, the percent amount will be different because the percent amount depends directly on the original amount. For example: 50% of 20 is 10. 50% of 10 is 5.Similarly, in two situations with the same amount of increase but different original amounts, the percent change of each amount is different. For example: Suppose two amounts increase by $5. If one original amount is $20, the increase is 25%. If the other original amount is $25, the increase is 20%.Goals and Learning ObjectivesIdentify errors in reasoning in percent situations.Use examples to explain why the reasoning is incorrect.
Students represent and solve percent decrease problems.Key ConceptsWhen there is a percent …
Students represent and solve percent decrease problems.Key ConceptsWhen there is a percent decrease between a starting amount and a final amount, the relationship can be represented by an equation of the form y = kx where y is the final amount, x is the starting amount, and k is the constant of proportionality, which is equal to 1 minus the percent change, p, represented as a decimal: k = 1 – p, so y = (1 – p)x.The constant of proportionality k has the value it does—a number less than 1—because of the way the distributive property can be used to simplify the expression for the starting amount decreased by a percent of the starting amount: x – x(p) = x(1 – p).Goals and Learning ObjectivesDetermine the unknown amount—either the starting amount, the percent change, or the final amount—in a percent decrease situation when given the other two amounts.Make a table to represent a percent decrease problem.Write and solve an equation to represent a percent decrease problem.
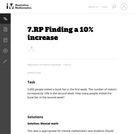
Students represent and solve percent increase problems.Key ConceptsWhen there is a percent …
Students represent and solve percent increase problems.Key ConceptsWhen there is a percent increase between a starting amount and a final amount, the relationship can be represented by an equation of the form y = kx where y is the final amount, x is the starting amount, and k is the constant of proportionality, which is equal to 1 plus the percent change, p, represented as a decimal: k = 1 + p, so y = (1 + p)x.The constant of proportionality k has the value it does—a number greater than 1—because of the way the distributive property can be used to simplify the expression for the starting amount increased by a percent of the starting amount: x + x(p) = x(1 + p).Goals and Learning ObjectivesDetermine the unknown amount—either the starting amount, the percent change, or the final amount—in a percent increase situation when given the other two amounts.Make a table to represent a percent increase problem.Write and solve an equation to represent a percent increase problem.
In Part 2 of this two-part lesson, students review and revise their …
In Part 2 of this two-part lesson, students review and revise their work on the Self Check task based on feedback from you and their peers and use what they’ve learned to solve similar problems.Key ConceptsStudents apply their knowledge, review their work, and make revisions based on feedback from you and their peers. This process creates a deeper understanding of the concepts.Goals and Learning ObjectivesUse feedback to refine solution strategies on the Self Check task.Deepen understanding of percent change.Apply deepened understanding to solve similar problems.
No restrictions on your remixing, redistributing, or making derivative works. Give credit to the author, as required.
Your remixing, redistributing, or making derivatives works comes with some restrictions, including how it is shared.
Your redistributing comes with some restrictions. Do not remix or make derivative works.
Most restrictive license type. Prohibits most uses, sharing, and any changes.
Copyrighted materials, available under Fair Use and the TEACH Act for US-based educators, or other custom arrangements. Go to the resource provider to see their individual restrictions.