September is a great time for data collection activities as students are …
September is a great time for data collection activities as students are naturally curious about their new classmates. Ask questions that require students to analyze data and support their conclusions.
The First Grade Elementary Framework for Science and Integrated Subjects, Sky Explorers …
The First Grade Elementary Framework for Science and Integrated Subjects, Sky Explorers uses observation of the sun and moon in the sky as a phenomena for exploring patterns of objects in the sky. It is part of Elementary Framework for Science and Integrated Subjects project, a statewide Clime Time collaboration among ESD 123, ESD 105, North Central ESD, and the Office of Superintendent of Public Instruction. Development of the resources is in response to a need for research- based science lessons for elementary teachers that are integrated with English language arts, mathematics and other subjects such as social studies. The template for Elementary Science and Integrated Subjects can serve as an organized, coherent and research-based roadmap for teachers in the development of their own NGSS aligned science lessons. Lessons can also be useful for classrooms that have no adopted curriculum as well as to serve as enhancements for current science curriculum. The EFSIS project brings together grade level teams of teachers to develop lessons or suites of lessons that are 1) pnenomena based, focused on grade level Performance Expectations, and 2) leverage ELA and Mathematics Washington State Learning Standards.
Module 3 begins by extending students kindergarten experiences with direct length comparison …
Module 3 begins by extending students kindergarten experiences with direct length comparison to indirect comparison whereby the length of one object is used to compare the lengths of two other objects. Longer than and shorter than are taken to a new level of precision by introducing the idea of a length unit. Students then explore the usefulness of measuring with similar units. The module closes with students representing and interpreting data.
Find the rest of the EngageNY Mathematics resources at https://archive.org/details/engageny-mathematics.
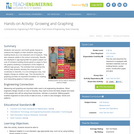
Students visit second- and fourth-grade classes to measure the heights of older …
Students visit second- and fourth-grade classes to measure the heights of older students using large building blocks as a non-standard unit of measure. They also measure adults in the school community. Results are displayed in age-appropriate bar graphs (paper cut-outs of miniature building blocks glued on paper to form bar graphs) enabling a comparison of the heights of different age groups. The activities that comprise this activity help students develop the concepts and vocabulary to describe, in a non-ambiguous way, how heights change as children age. This introduction to graphing provides an important foundation for creating and interpreting graphs in future years.
In this guide, students’ exploration of AI is framed within the context …
In this guide, students’ exploration of AI is framed within the context of ethical considerations and aligned with standards and concepts, and depths of understanding that would be appropriate across various subject areas and grade levels in K–12. Depending on the level of your students and the amount of time you have available, you might complete an entire project, pick and choose from the listed activities, or you might take students’ learning further by taking advantage of the additional extensions and resources provided for you. For students with no previous experience with AI education, exposure to the guided learning activities alone will create an understanding of their world that they likely did not previously have. And for those with some background in computer science or AI, the complete projects and resources will still challenge their thinking and expose them to new AI technologies and applications across various fields of study.
Project 1: Fair's Fair Project 2: Who is in Control? Project 3: The Trade-offs of AI Technology Project 4: AI and the 21st Century Worker
Visit the ISTE website with all the free practical guides for engaging students in AI creation: https://www.iste.org/areas-of-focus/AI-in-education.
Kindergartners measure each other's height using large building blocks, then visit a …
Kindergartners measure each other's height using large building blocks, then visit a 2nd and a 4th grade class to measure those students. They can also measure adults in the school community. Results are displayed in age-appropriate bar graphs (paper cut-outs of miniature building blocks glued on paper to form a bar graph) comparing the different age groups. The activities that comprise this lesson help students develop the concepts and vocabulary to describe, in a non-ambiguous way, how height changes as children get older. The introduction to graphing provides an important foundation for both creating and interpreting graphs in future years.
Students will record the temperature daily, using a bar graph, color coded …
Students will record the temperature daily, using a bar graph, color coded bars. this monthly bar graph helps students understand phenology and interpreting graphs.
Students plant sunflower seeds in plastic cups, and once germinated, expose them …
Students plant sunflower seeds in plastic cups, and once germinated, expose them to varying light or soil moisture conditions. They measure growth of the seedlings every few days using non-standard measurement (inch cubes). After a few weeks, they compare the growth of plants exposed to the different conditions and make bar comparative graphs, which they analyze to draw conclusions about the needs of plants.
(Nota: Esta es una traducción de un recurso educativo abierto creado por …
(Nota: Esta es una traducción de un recurso educativo abierto creado por el Departamento de Educación del Estado de Nueva York (NYSED) como parte del proyecto "EngageNY" en 2013. Aunque el recurso real fue traducido por personas, la siguiente descripción se tradujo del inglés original usando Google Translate para ayudar a los usuarios potenciales a decidir si se adapta a sus necesidades y puede contener errores gramaticales o lingüísticos. La descripción original en inglés también se proporciona a continuación.)
El módulo 3 comienza extendiendo las experiencias de jardín de infantes de los estudiantes con una comparación de longitud directa con la comparación indirecta por la cual la longitud de un objeto se usa para comparar las longitudes de otros dos objetos. Más largo que y más corto que se llevan a un nuevo nivel de precisión al introducir la idea de una unidad de longitud. Luego, los estudiantes exploran la utilidad de medir con unidades similares. El módulo se cierra con estudiantes que representan e interpretan datos.
Encuentre el resto de los recursos matemáticos de Engageny en https://archive.org/details/engageny-mathematics.
English Description: Module 3 begins by extending students kindergarten experiences with direct length comparison to indirect comparison whereby the length of one object is used to compare the lengths of two other objects. Longer than and shorter than are taken to a new level of precision by introducing the idea of a length unit. Students then explore the usefulness of measuring with similar units. The module closes with students representing and interpreting data.
Find the rest of the EngageNY Mathematics resources at https://archive.org/details/engageny-mathematics.
The intent of clarifying statements is to provide additional guidance for educators …
The intent of clarifying statements is to provide additional guidance for educators to communicate the intent of the standard to support the future development of curricular resources and assessments aligned to the 2021 math standards. Clarifying statements can be in the form of succinct sentences or paragraphs that attend to one of four types of clarifications: (1) Student Experiences; (2) Examples; (3) Boundaries; and (4) Connection to Math Practices.
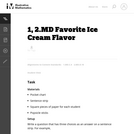
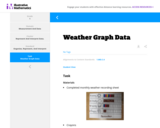
The purpose of this task is for students to represent and interpret …
The purpose of this task is for students to represent and interpret weather data, as well as answer questions about the data they have recorded. Teachers could modify this task to include the most common weather in their local area.
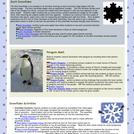
There are many possibilities for winter math data collection activities. Look for …
There are many possibilities for winter math data collection activities. Look for opportunities to have students create tally charts, clothespin graphs, Venn diagrams, bar and line graphs to organize data and analyze the results of the data collection. Build on students' natural fascination with penguins by including these math pattern activities. The Koch Snowflake is an example of an iterative drawing as each successive stage begins with the previous stage. The Koch snowflake begins with an equilateral triangle.
No restrictions on your remixing, redistributing, or making derivative works. Give credit to the author, as required.
Your remixing, redistributing, or making derivatives works comes with some restrictions, including how it is shared.
Your redistributing comes with some restrictions. Do not remix or make derivative works.
Most restrictive license type. Prohibits most uses, sharing, and any changes.
Copyrighted materials, available under Fair Use and the TEACH Act for US-based educators, or other custom arrangements. Go to the resource provider to see their individual restrictions.