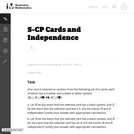
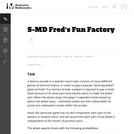
This task was developed by high school and postsecondary mathematics and design/pre-construction …
This task was developed by high school and postsecondary mathematics and design/pre-construction educators, and validated by content experts in the Common Core State Standards in mathematics and the National Career Clusters Knowledge & Skills Statements. It was developed with the purpose of demonstrating how the Common Core and CTE Knowledge & Skills Statements can be integrated into classroom learning - and to provide classroom teachers with a truly authentic task for either mathematics or CTE courses.
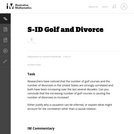
This task was developed by high school and postsecondary mathematics and health …
This task was developed by high school and postsecondary mathematics and health sciences educators, and validated by content experts in the Common Core State Standards in mathematics and the National Career Clusters Knowledge & Skills Statements. It was developed with the purpose of demonstrating how the Common Core and CTE Knowledge & Skills Statements can be integrated into classroom learning - and to provide classroom teachers with a truly authentic task for either mathematics or CTE courses.
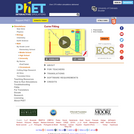
With your mouse, drag data points and their error bars, and watch …
With your mouse, drag data points and their error bars, and watch the best-fit polynomial curve update instantly. You choose the type of fit: linear, quadratic, cubic, or quartic. The reduced chi-square statistic shows you when the fit is good. Or you can try to find the best fit by manually adjusting fit parameters.
This is a task from the Illustrative Mathematics website that is one …
This is a task from the Illustrative Mathematics website that is one part of a complete illustration of the standard to which it is aligned. Each task has at least one solution and some commentary that addresses important aspects of the task and its potential use.
This task requires students to use the normal distribution as a model …
This task requires students to use the normal distribution as a model for a data distribution. Students must use given means and standard deviations to approximate population percentages. There are several ways (tables, graphing calculators, or statistical software) that students might calculate the required normal percentages. Depending on the method used, answers might vary somewhat from those shown in the solution.
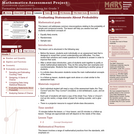
This lesson unit addresses common misconceptions relating to probability of simple and …
This lesson unit addresses common misconceptions relating to probability of simple and compound events. The lesson will help you assess how well students understand concepts of: Equally likely events; randomness; and sample sizes.
Midterm Exam Review for the course "CS 217 – Probability and Statistics …
Midterm Exam Review for the course "CS 217 – Probability and Statistics for Computer Science" delivered at the City College of New York in Spring 2019 by Evan Agovino as part of the Tech-in-Residence Corps program.
Practice Final Exam for the course "CS 217 – Probability and Statistics …
Practice Final Exam for the course "CS 217 – Probability and Statistics for Computer Science" delivered at the City College of New York in Spring 2019 by Evan Agovino as part of the Tech-in-Residence Corps program.
This learning video presents an introduction to the Flaws of Averages using …
This learning video presents an introduction to the Flaws of Averages using three exciting examples: the ''crossing of the river'' example, the ''cookie'' example, and the ''dance class'' example. Averages are often worthwhile representations of a set of data by a single descriptive number. The objective of this module, however, is to simply point out a few pitfalls that could arise if one is not attentive to details when calculating and interpreting averages. The essential prerequisite knowledge for this video lesson is the ability to calculate an average from a set of numbers. During this video lesson, students will learn about three flaws of averages: (1) The average is not always a good description of the actual situation, (2) The function of the average is not always the same as the average of the function, and (3) The average depends on your perspective. To convey these concepts, the students are presented with the three real world examples mentioned above.
This video lesson shows students that math can play a role in …
This video lesson shows students that math can play a role in understanding how an infectious disease spreads and how it can be controlled. During this lesson, students will see and use both deterministic and probabilistic models and will learn by doing through role-playing exercises. The primary exercises between video segments of this lesson are class-intensive simulation games in which members of the class 'infect' each other under alternative math modeling assumptions about disease progression. Also there is an occasional class discussion and local discussion with nearby classmates.
In this dynamic data science game, students try to track down a …
In this dynamic data science game, students try to track down a speck of extremely dangerous radioactive material (the "source"), which has been lost somewhere in the middle of their lab. A special device measures the strength of the radiation and, if it’s positioned correctly over the speck, can be used to collect it for safe disposal. But it's a tiny speck, so they have to give quite precise coordinates. They take measurements to figure out the speck’s location, but must beware: as they take measurements, they're also accumulating radiation exposure. If they get too much, they’ll lose the game and will have to start over. Can they find the source before it’s too late? Using mathematical models, students generate useful strategies for winning the game with data.
This is a simple task addressing the distinction between correlation and causation. …
This is a simple task addressing the distinction between correlation and causation. Students are given information indicating a correlation between two variables, and are asked to reason out whether or not a causation can be inferred. The task would be well-suited either as an introduction to this distinction, or as an assessment item.
No restrictions on your remixing, redistributing, or making derivative works. Give credit to the author, as required.
Your remixing, redistributing, or making derivatives works comes with some restrictions, including how it is shared.
Your redistributing comes with some restrictions. Do not remix or make derivative works.
Most restrictive license type. Prohibits most uses, sharing, and any changes.
Copyrighted materials, available under Fair Use and the TEACH Act for US-based educators, or other custom arrangements. Go to the resource provider to see their individual restrictions.