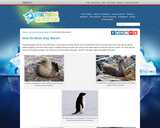
Through a discussion board, students comment and respond to paper topics on …
Through a discussion board, students comment and respond to paper topics on the human impacts on sharks.
(Note: this resource was added to OER Commons as part of a batch upload of over 2,200 records. If you notice an issue with the quality of the metadata, please let us know by using the 'report' button and we will flag it for consideration.)
Students will be required to answer a series of simple questions for …
Students will be required to answer a series of simple questions for this assignment based on material covered in lecture. This assignment also allows students the experience of searching a website for more specific information about hurricane statistics that are not covered in lecture. Hurricane Katrina will be discussed in lecture. Students will see where Katrina falls relative to other major hurricanes while answering the questions.
(Note: this resource was added to OER Commons as part of a batch upload of over 2,200 records. If you notice an issue with the quality of the metadata, please let us know by using the 'report' button and we will flag it for consideration.)
This homework assignment is given in the first two weeks of class. …
This homework assignment is given in the first two weeks of class. Students receive one or two lectures that cover the topics of atmospheric layers, temperature and pressure profiles, concepts of atmospheric mass and pressure and measuring (i.e. dropsonde) instrumentation. At the beginning of each lecture I briefly show them the tropical update from the NOAA National Hurricane Center web site; if there is an active storm, I show where I go to get more info, such as the projected storm track and storm history (for example, from Intellicast Hurricane Tracking). Then, for this assignment, I reintroduce them to these hurricane information web sites and demonstrate how to find the historical data on tropical storms (such as from the Unisys Hurricane Data Archive), and how to copy and paste text data into word and/or excel, as a tab- or space-delimited file. I point out some problem areas with this data-grabbing method, such as headers that get lost from their associated data column or date information that may not format as dates. I then hand out the assignment, which asks them to:
Find data on a current or recent (this year) tropical system, provide the name and year of the storm and the reference web site, and plot the wind speed and pressure variables against time. Students should label the axes and give a descriptive title to the chart. Describe what they notice in the graphed data and if it seems believable (this allows students to decide if they have done the task correctly by using their understanding of the data). Predict what will happen if the storm a) intensifies or b) weakens. I then provide another data set (of any long-duration tropical storm that formed, weakened and later re-intensified) and ask them to go through the same process of plotting and interpretation. I tell them that some future climate predictions are for more storms with lower central pressures and ask which of the two charts best represents that future scenario, and why.
(Note: this resource was added to OER Commons as part of a batch upload of over 2,200 records. If you notice an issue with the quality of the metadata, please let us know by using the 'report' button and we will flag it for consideration.)
An exercise to use a simple image analysis program to classify land …
An exercise to use a simple image analysis program to classify land surface types seen in satellite imagery in order to analyze changes in landscape development over time.
(Note: this resource was added to OER Commons as part of a batch upload of over 2,200 records. If you notice an issue with the quality of the metadata, please let us know by using the 'report' button and we will flag it for consideration.)
"In Search of GLOBE Data" contains two self-paced projects on using the …
"In Search of GLOBE Data" contains two self-paced projects on using the graphing and mapping tools available on the GLOBE Web site (www.globe.gov (more info) ). These sequential how-to guides on searching for schools with usable data include questions inquiring into what the user sees or thinks about the data presented. These questions are intended to stimulate the thinking process. An answer sheet has been provided to assist the facilitator of this activity. These student worksheets are followed by an advanced search for GLOBE data. This is a step-by-step, or click-by-click, how-to guide to help expand the list of tools when searching for GLOBE data. An Advanced Search is also included; however there are no questions associated with this part of the activity. If the user proceeds directly from the Student Worksheets they may be able to construct their own questions when visualizing the data using these advanced tools.
(Note: this resource was added to OER Commons as part of a batch upload of over 2,200 records. If you notice an issue with the quality of the metadata, please let us know by using the 'report' button and we will flag it for consideration.)
In essence, this is an opportunity for students to practice calculating trends …
In essence, this is an opportunity for students to practice calculating trends with uncertainties to draw conclusions about whether or not there is a trend in hurricane intensity. It follows closely with the IPCC AR4 findings, and is guided so that students will know exactly what they have to do - step by step. Please see the attached document for the bulk of the activity. There are some additional instructor's notes that give a little more background on the concepts involved with confidence intervals and trends. There is also an excel file with all of the necessary data already tabulated for the exercise - so you don't need to go find it yourself unless you want to.
(Note: this resource was added to OER Commons as part of a batch upload of over 2,200 records. If you notice an issue with the quality of the metadata, please let us know by using the 'report' button and we will flag it for consideration.)
This second introductory lesson in GeoMapApp begins with a historical look at …
This second introductory lesson in GeoMapApp begins with a historical look at methods of surveying the seafloor, from lead line surveys to modern multibeam and side-scan sonar. Then, a series of instructions takes students trough the bathymetric tools of GeoMapApp. Activity includes both student and instructor versions.
(Note: this resource was added to OER Commons as part of a batch upload of over 2,200 records. If you notice an issue with the quality of the metadata, please let us know by using the 'report' button and we will flag it for consideration.)
Corals, like other living animals, require a particular range of environmental conditions …
Corals, like other living animals, require a particular range of environmental conditions to survive. In this lab, students examine sea surface temperature, depth, salinity, and aragonite saturation data to discover coral reefs' favored environments.
(Note: this resource was added to OER Commons as part of a batch upload of over 2,200 records. If you notice an issue with the quality of the metadata, please let us know by using the 'report' button and we will flag it for consideration.)
In this physical geography lab, students examine the relationship between solar altitude, …
In this physical geography lab, students examine the relationship between solar altitude, solar declination, and temperature regimes. Using data collected in the field, mathematical relationships, and temperature records available on the Internet, students compare the insolation and climate in their location to that of other locations.
(Note: this resource was added to OER Commons as part of a batch upload of over 2,200 records. If you notice an issue with the quality of the metadata, please let us know by using the 'report' button and we will flag it for consideration.)
This exercise set explores marine sediments using core photos and authentic datasets …
This exercise set explores marine sediments using core photos and authentic datasets in an inquiry-based approach. Students' prior knowledge of sea floor sediments is explored in Part 1. In Parts 2-3 students observe and describe the physical characteristics of sediment cores and determine the composition using smear slide data and a decision tree. In Part 4 students develop a map showing the distribution of the primary marine sediment types of the Pacific and North Atlantic Oceans and develop hypotheses to explain the distribution of the sediment types shown on their map.
(Note: this resource was added to OER Commons as part of a batch upload of over 2,200 records. If you notice an issue with the quality of the metadata, please let us know by using the 'report' button and we will flag it for consideration.)
This lesson is designed to reinforce the basic skill sets and concepts …
This lesson is designed to reinforce the basic skill sets and concepts introduced in Lessons 1‐3 of this module. Students will use the steps of the Geographic Approach to explore data sets and images in a scientific manner.
(Note: this resource was added to OER Commons as part of a batch upload of over 2,200 records. If you notice an issue with the quality of the metadata, please let us know by using the 'report' button and we will flag it for consideration.)
Because the campuses of the University of Kansas and the University of …
Because the campuses of the University of Kansas and the University of Houston are almost directly on a N-S line we can duplicate many aspects of the classic measurement of Eratosthenese in determining the circumference of the Earth. We use a web cast (backed up by cell phones) to communicate between the two campuses in real time. We measure the shadow of a 2 m stick in both locations at the same time and then go through the math required to calculate the size of the planet.
(Note: this resource was added to OER Commons as part of a batch upload of over 2,200 records. If you notice an issue with the quality of the metadata, please let us know by using the 'report' button and we will flag it for consideration.)
Explore how melting of ice cubes floating in water is influenced by …
Explore how melting of ice cubes floating in water is influenced by the salinity of the water. Important oceanographic concepts like density and density driven currents are visualized and can be discussed on the basis of this experiment.
(Note: this resource was added to OER Commons as part of a batch upload of over 2,200 records. If you notice an issue with the quality of the metadata, please let us know by using the 'report' button and we will flag it for consideration.)
Students pick a place of significance to them (their Special Place) for …
Students pick a place of significance to them (their Special Place) for analysis in this semester-long project. (A model is provided by the instructor using a place the students are not likely to have visited.)
(Note: this resource was added to OER Commons as part of a batch upload of over 2,200 records. If you notice an issue with the quality of the metadata, please let us know by using the 'report' button and we will flag it for consideration.)
This jigsaw exercise has students study national parks from different perspectives. Groups …
This jigsaw exercise has students study national parks from different perspectives. Groups can be divided up depending on the nature of the class: historian, meteorologist, geologist, and biologist.
(Note: this resource was added to OER Commons as part of a batch upload of over 2,200 records. If you notice an issue with the quality of the metadata, please let us know by using the 'report' button and we will flag it for consideration.)
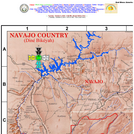
This map of the Navajo Nation illustrates settlements, landforms, water features, parks, …
This map of the Navajo Nation illustrates settlements, landforms, water features, parks, forests, and neighboring Indian reservations. The map index provides links to additional information about some of these features.
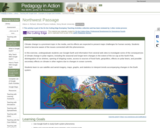
An investigation of changes in polar regions using Google Earth. (Note: this …
An investigation of changes in polar regions using Google Earth.
(Note: this resource was added to OER Commons as part of a batch upload of over 2,200 records. If you notice an issue with the quality of the metadata, please let us know by using the 'report' button and we will flag it for consideration.)
Oceans Socratic questions and answers. (Note: this resource was added to OER …
Oceans Socratic questions and answers.
(Note: this resource was added to OER Commons as part of a batch upload of over 2,200 records. If you notice an issue with the quality of the metadata, please let us know by using the 'report' button and we will flag it for consideration.)
Volcanic debris flows (lahars) flow long distances, bury and aggrade river valleys, …
Volcanic debris flows (lahars) flow long distances, bury and aggrade river valleys, and cause long-term stream disturbances and dramatic landscape changes. Students will evaluate the nature, scale, and history of past lahars from Mount Rainier in a river valley and interpret the past and potential future impact on humans of lahars.
(Note: this resource was added to OER Commons as part of a batch upload of over 2,200 records. If you notice an issue with the quality of the metadata, please let us know by using the 'report' button and we will flag it for consideration.)
No restrictions on your remixing, redistributing, or making derivative works. Give credit to the author, as required.
Your remixing, redistributing, or making derivatives works comes with some restrictions, including how it is shared.
Your redistributing comes with some restrictions. Do not remix or make derivative works.
Most restrictive license type. Prohibits most uses, sharing, and any changes.
Copyrighted materials, available under Fair Use and the TEACH Act for US-based educators, or other custom arrangements. Go to the resource provider to see their individual restrictions.