Using the 5E instructional model, students discover the value of using color …
Using the 5E instructional model, students discover the value of using color maps to visualize data. The activity requires students to create a color map of the ozone hole from Dobson data values derived from the Aura satellite. Students then interpret that map and compare and evaluate different color scales. Note that this is the Spanish version of Exploring Color Maps: Using Stratospheric Ozone Data.
Through the use of the 5E instructional model, students discover the value …
Through the use of the 5E instructional model, students discover the value of using color maps to visualize data. The activity requires students to create a color map of the ozone hole from Dobson data values derived from the Aura satellite. Students then interpret that map and compare and evaluate different color scales.
Research physical scientist, Dr. Dalia Kirschbaum, is featured in this short (~3 …
Research physical scientist, Dr. Dalia Kirschbaum, is featured in this short (~3 min.) video. Dr. Kirschbaum explains how the integration of her initial interest in math and her subsequent interest in the science of natural disasters lead to her career focus of landslide modeling. Now part of the NASA Global Precipitation Measurement (GPM) team, she communicates about the GPM mission and data to the public and to others who use it in their work and/or research.
Focusing on air, water, land and life, this video describes how these …
Focusing on air, water, land and life, this video describes how these components are connected in the Earth system through the flow of energy, cycles of water and biogeochemistry. Methods of studying the Earth system, ranging from field observations to analysis of satellite images are discussed. This video is one of the 24-part instructional video series describing scientific protocols used by GLOBE (Global Learning and Observation to Benefit the Environment), a worldwide, hands-on, K-12 school-based science education program.
This video highlights students taking scientific measurements to support investigations in atmospheric …
This video highlights students taking scientific measurements to support investigations in atmospheric science, hydrology, soils, and land cover. It shows students reporting data through the Web, creating scientific visualizations for analysis, and collaborating with students and scientists around the world. This is one two introductory videos in the 24-part GLOBE video series. GLOBE (Global Learning and Observation to Benefit the Environment) is a worldwide, hands-on, K-12 school-based science education program.
This video highlights students taking scientific measurements to support investigations in atmospheric …
This video highlights students taking scientific measurements to support investigations in atmospheric science, hydrology, soils, and land cover. It shows students reporting data through the Web, creating scientific visualizations for analysis, and collaborating with students and scientists around the world. This is one of two introductory videos in the 24-part GLOBE video series. GLOBE (Global Learning and Observation to Benefit the Environment) is a worldwide, hands-on, K-12 school-based science education program.
The purpose of this investigation is to understand the change that takes …
The purpose of this investigation is to understand the change that takes place when water condenses from a gas to a liquid, and how a change in pressure affects this transformation. Materials needed for the experiment include a large (2L) soda bottle, a squeeze bottle with a plastic hose, parking pens, construction paper, wooden matches, and tap water. The resource includes background information, a pre-activity exploration for students, teaching tips and questions to guide student discussion. This is the chapter 12 of Meteorology: An Educator's Resource for Inquiry-Based Learning for Grades 5-9. The guide includes a discussion of learning science, the use of inquiry in the classroom, instructions for making simple weather instruments, and more than 20 weather investigations ranging from teacher-centered to guided and open inquiry investigations.
In this problem-based learning activity, students learn about weather forecasting and the …
In this problem-based learning activity, students learn about weather forecasting and the role of the TRMM (Tropical Rainfall Measuring Mission) satellite in data collection. Assuming the role of climatologists, students assist a reporter in determining the accuracy of weather predictions published in The Old Farmer's Almanac. The lesson requires a street map of the local community, acetate sheets to cover the map, materials needed to build a homemade rain gauge, and sample pages of the almanac. Teacher notes, student worksheet, glossary and an appendix introducing problem-based learning are included. This resource is the first of the 3-part learning module, Investigating the Climate System: Precipitation.
In this 2-part inquiry-based lesson, students conduct a literature search to determine …
In this 2-part inquiry-based lesson, students conduct a literature search to determine the characteristics of the atmospheres of different planets (Venus, Mercury, Mars and Earth). After collecting and analyzing data, student teams design and conduct a controlled physical experiment using a lab apparatus to learn about the interaction of becomes CO², air, and temperature. The resource includes student worksheets, a design proposal, and student questions. Connections to contemporary climate change are addressed. This lesson is the first of four in Topic 4, "How do Atmospheres Affect Planetary Temperatures?" within the resource, Earth Climate Course: What Determines a Planet's Climate?
In this kinesthetic activity, the concept of energy budget is strengthened as …
In this kinesthetic activity, the concept of energy budget is strengthened as students conduct three simulations using play money as units of energy, and students serve as parts of a planetary radiation balance model. Students will determine the energy budget of a planet by manipulating gas concentrations, energy inputs and outputs in the system in this lesson that supports the study of climate on Mars, Mercury, Venus and Earth. The lesson supports understanding of the real-world problem of contemporary climate change. The resource includes a teacher's guide and several student worksheets. This is the second of four activities in the lesson, How do Atmospheres affect planetary temperatures?, within Earth Climate Course: What Determines a Planet's Climate? The resource aims to help students to develop an understanding of our environment as a system of human and natural processes that result in changes that occur over various space and time scales.
In this activity, students simulate the interaction of variables, including carbon dioxide, …
In this activity, students simulate the interaction of variables, including carbon dioxide, in a radiation balance exercise using a spreadsheet-based radiation balance model. Through a series of experiments, students attempt to mimic the surface temperatures of Earth, Mercury, Venus and Mars, and account for the influence of greenhouse gases in atmospheric temperatures. The activity supports inquiry into the real-world problem of contemporary climate change. Student-collected data is needed from activity A in the same module, "How do atmospheres interact with solar energy?" to complete this activity. Included in the resource are several student data sheets and a teacher's guide. This activity is part of module 4, "How do Atmospheres Affect Planetary Temperatures?" in Earth Climate Course: What Determines a Planet's Climate? The course aims to help students to develop an understanding of our environment as a system of human and natural processes that result in changes that occur over various space and time scales.
This ChemMatters article provides a brief background on smog, then examines the …
This ChemMatters article provides a brief background on smog, then examines the causes of it, efforts to reduce it, and methods used to measure it. ChemMatters is an educational magazine for high school students.
Logarithms are very handy when dealing with numbers at different scales but …
Logarithms are very handy when dealing with numbers at different scales but they are also useful helping us average measurements of physical phenomena that have nonlinear behavior. In this example, students learn about cloud albedo and calculating cloud optical depth. This resource is from PUMAS - Practical Uses of Math and Science - a collection of brief examples created by scientists and engineers showing how math and science topics taught in K-12 classes have real world applications.
This resource describes the physics behind the formation of clouds, and provides …
This resource describes the physics behind the formation of clouds, and provides a demonstration of those principles using a beaker, ice, a match, hot water, and a laser pointer. This resource is from PUMAS - Practical Uses of Math and Science - a collection of brief examples created by scientists and engineers showing how math and science topics taught in K-12 classes have real world applications.
In this short demo/activity, a balloon with baking soda in it is …
In this short demo/activity, a balloon with baking soda in it is stretched over the mouth of a flask or bottle containing vinegar. The balloon is tipped so that the baking soda falls into the vinegar, and the reaction creates carbon dioxide, which inflates the balloon. The activity is part of the children's book, The Air We Breathe.
In this activity, student teams design small-scale physical models of hot and …
In this activity, student teams design small-scale physical models of hot and cold planets, (Venus and Mars), and learn that small scale models allow researchers to determine how much larger systems function. There is both a team challenge and competition built into this activity. Experimental findings are then used to support a discussion of human outposts on Mars. The resource includes an experimental design guide for students as well as a handout outlining a method for the design of controlled experiments, and student data sheets. Student questions and an essay assignment are provided as classroom assessments. This is Activity A in the second module, titled "Modeling hot and cold planets," of the resource, "Earth Climate Course: What Determines a Planet's Climate?" The course aims to help students to develop an understanding of our environment as a system of human and natural processes that result in changes that occur over various space and time scales.
In this activity, students pose several hypotheses for what will happen if …
In this activity, students pose several hypotheses for what will happen if you continue heating or supplying energy to the hot and cold planet models (Mercury, Mars, Venus, and Earth) and then test their hypotheses using a spreadsheet based radiation balance model. The activity supports investigation of a real world challenge, experimenting with life support conditions for Mars at an Arctic outpost. The interactive model runs are conducted using a Java applet. This resource includes student worksheets, assessment questions and a teacher's guide. This is Activity B in module 2, Modeling hot and cold planets, of the resource, Earth Climate Course: What Determines a Planet's Climate? The course aims to help students to develop an understanding of our environment as a system of human and natural processes that result in changes that occur over various space and time scales.
In this activity, students explore the importance of adequate sampling strategies when …
In this activity, students explore the importance of adequate sampling strategies when conducting a scientific investigation. They are tasked with determining the average temperature of the Earth, using data sets easily found on the Internet, and determine the kind and size of sample necessary to calculate a representative average. The resource includes a student data sheet and an authentic assessment for the module, where students discuss the establishment of a habitation site on Mars. This is Activity C in module 2, titled "Modeling Hot and Cold Planets," of the resource, Earth Climate Course: What Determines a Planet's Climate? The course aims to help students to develop an understanding of our environment as a system of human and natural processes that result in changes that occur over various space and time scales.
In this activity, students view a satellite image of Earth at night, …
In this activity, students view a satellite image of Earth at night, and consider the environmental considerations and consequences associated with the pattern of light they see. The resource includes a map for student use. Summary background information, data and images supporting the activity are available on the Earth Update data site. To complete the activity, students will need to access the Space Update multimedia collection, which is available for download and purchase for use in the classroom.
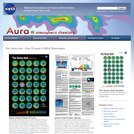
This two-sided poster presents images and information about ozone. The front features …
This two-sided poster presents images and information about ozone. The front features a series of color Earth images; each image reflects total ozone readings taken every October from 1979 to 2012. The poster back contains information about ozone under the following headings: What is Ozone?, Chemistry of the Ozone Layer, Measuring Ozone in the Earth's Atmosphere, Timeline of Stratospheric Ozone Depletion and Observations, How the Ozone Hole Forms, and A World Avoided. In addition, the back contains two activities: Visualizing the Ozone Hole and a Color by Number worksheet.
No restrictions on your remixing, redistributing, or making derivative works. Give credit to the author, as required.
Your remixing, redistributing, or making derivatives works comes with some restrictions, including how it is shared.
Your redistributing comes with some restrictions. Do not remix or make derivative works.
Most restrictive license type. Prohibits most uses, sharing, and any changes.
Copyrighted materials, available under Fair Use and the TEACH Act for US-based educators, or other custom arrangements. Go to the resource provider to see their individual restrictions.