Students and professionals in science, design and technology have to develop and …
Students and professionals in science, design and technology have to develop and communicate concepts that are often difficult to comprehend for the public, their peers and even themselves.
IMAGE | ABILITY – Visualizing the Unimaginable, will help you enhance your communication and interpersonal skills and provide insight, tips and tricks to make such complex and seemingly unimaginable concepts and ideas imaginable.
After finishing this course you will be more skilled in finding the right visual language to convey your ideas, thoughts and vision. You will be able to illustrate units and quantities, concepts and themes and you will know how to unravel complexity by using diagrams and schemes.
Diagrams, charts and graphs are used by all sorts of people to …
Diagrams, charts and graphs are used by all sorts of people to express information in a visual way, whether it's in a report by a colleague or a plan from your interior designer. This unit will teach you how to interpret these tools and how to use them yo
Students apply the vocabulary and concepts from the Activity 9: Feedback Loop …
Students apply the vocabulary and concepts from the Activity 9: Feedback Loop Introduction to assess and create earth science feedback loops with the LOOPY online modeling program. (Optional) The students then engage in a discussion of the limitations of the LOOPY program to create feedback loop diagrams.
Students are introduced to feedback loop vocabulary and experiment with different relationships …
Students are introduced to feedback loop vocabulary and experiment with different relationships between reservoirs in simple feedback loops using LOOPY, a free, online modeling program.
This site demonstrates where each of the Arabic letters is produced using …
This site demonstrates where each of the Arabic letters is produced using an illustration of the human mouth and throat. Visitors can view the approximate location of each letter on the diagram, and hear what each letter sounds like when paired with any of the short or long Arabic vowels.
This activity teaches students about the value of planning, knowing, and explaining …
This activity teaches students about the value of planning, knowing, and explaining the limitations of a systems diagram. Students are taught to follow the following four steps when assessing the limitations of a systems diagram: identify the question, identify the scope, identify the missing sources, identify the level of detail. Students then assess the limitations of a systems diagram they previously created, and reflect on how assessing the limitations of a systems diagram also allows them to identify ways to improve their systems diagrams.
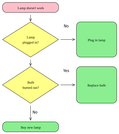
A flow chart can be a useful tool in problem solving. You …
A flow chart can be a useful tool in problem solving. You can see at a glance how your decisions and actions affect the outcome of your problem solving process. This lesson will help you learn the symbols and steps for writing a flowchart.
No restrictions on your remixing, redistributing, or making derivative works. Give credit to the author, as required.
Your remixing, redistributing, or making derivatives works comes with some restrictions, including how it is shared.
Your redistributing comes with some restrictions. Do not remix or make derivative works.
Most restrictive license type. Prohibits most uses, sharing, and any changes.
Copyrighted materials, available under Fair Use and the TEACH Act for US-based educators, or other custom arrangements. Go to the resource provider to see their individual restrictions.