Updating search results...

Search Resources

436 Results

View
Selected filters:
  • Measurement and Data
  • Community College / Lower Division
A Case Study: Geology, Remediation, Investigation at a RR Repair Shop Brownfield Site, St. Paul, Minnesota
Conditional Remix & Share Permitted
CC BY-NC-SA
Rating
0.0 stars

A case-study approach can be used to introduce students to the work that geologists do as environmental consultants. Data used by environmental consultants for a Brownfield site that is currently undergoing redevelopment in St. Paul, MN has been adapted for in-class study, either as a series of short exercises, or as part of a larger project.

(Note: this resource was added to OER Commons as part of a batch upload of over 2,200 records. If you notice an issue with the quality of the metadata, please let us know by using the 'report' button and we will flag it for consideration.)
Subject:
Chemistry
Mathematics
Measurement and Data
Physical Science
Statistics and Probability
Material Type:
Activity/Lab
Case Study
Provider:
Science Education Resource Center (SERC) at Carleton College
Provider Set:
Teach the Earth
Author:
Kate Kleiter
Date Added:
08/12/2019
Chemical Differentiation in the Palisades Sill
Conditional Remix & Share Permitted
CC BY-NC-SA
Rating
0.0 stars

The purpose of this assignment is for students to synthesize field observations, petrography, and whole-rock chemical analyses in order to investigate chemical differentiation processes in a basaltic magma chamber. The students first complete a petrography lab on both hand samples and thin sections that represent a complete stratigraphic section through sill at Fort Lee, NJ. I then provide them with major- and trace-element data and a table of distribution coefficients for common phases that would be crystallizing from basaltic magma. I then ask them to discuss the chemical differentiation of the sill by writing up a 1-2 page interpretative summary based on their petrographic observations and the chemical data.

(Note: this resource was added to OER Commons as part of a batch upload of over 2,200 records. If you notice an issue with the quality of the metadata, please let us know by using the 'report' button and we will flag it for consideration.)
Subject:
Biology
Chemistry
Life Science
Mathematics
Measurement and Data
Physical Science
Statistics and Probability
Material Type:
Activity/Lab
Data Set
Lesson Plan
Provider:
Science Education Resource Center (SERC) at Carleton College
Provider Set:
Teach the Earth
Author:
Matthew Gorring
Date Added:
08/06/2019
Choropleth Map of the Happiest States
Conditional Remix & Share Permitted
CC BY-NC-SA
Rating
0.0 stars

GIS techniques, data sources, and other resources are so numerous and varied that, even if someone is doing GIS work regularly, it's common to say, "Now how did I do that last time?" or "Where did I get that data?". One of the main goals of my GIS course is to have students create a personal GIS portfolio that will be useful to them in the future, either for projects at Hamilton or in a job after graduation.
Portfolios must include, at a minimum, a spreadsheet of data sources and information about downloading and prepping data from each site; an annotated Word doc of useful web sites; a DVD collection of projects and data from the course; and an organized notebook that contains the items listed above plus all class handouts, exercises, and printouts of products.

What I stress in this assignment is that portfolios need to be more than collections of GIS stuff – they must be useful for the future. To make portfolios useful for the future, students have to give significant thought not only to organization but how they will be able to find information in their portfolios in the future and how they can build indexes, annotations, flow charts, etc. to make their portfolios more than a collection of pieces of paper in a binder.

Subject:
Education
Educational Technology
Mathematics
Measurement and Data
Material Type:
Activity/Lab
Provider:
Science Education Resource Center (SERC) at Carleton College
Provider Set:
Teach the Earth
Author:
Barb Tewksbury
Date Added:
01/20/2023
City Seminary 1: Quantitative Reasoning
Conditional Remix & Share Permitted
CC BY-NC-SA
Rating
0.0 stars

To participate in a data-intensive, twenty-first century society, you must be able to interpret, manipulate, and communicate quantitative information. Quantitative Reasoning (QR), also sometimes called quantitative literacy, is a habit of mind that enables you to make sense of the numerical aspects of real-life situations. By the end of this course, students are expected to be able to read, understand and create quantitative data using various analytical and graphical means.

Subject:
Measurement and Data
Material Type:
Lecture
Author:
Ashfaq Khan
Date Added:
05/23/2020
Climate Change and Atlantic Hurricanes: A GIS Inquiry
Conditional Remix & Share Permitted
CC BY-NC-SA
Rating
0.0 stars

Students are asked to make a general hypothesis about whether Atlantic hurricane have been changing over time in response to recent climate change. It is expected that at an introductory level with only the most basic background instruction, students will focus on numbers, locations, or intensities of hurricanes. Example hypotheses might be

The numbers of hurricanes are increasing (or decreasing)
Hurricanes are becoming more intense
Hurricanes are forming in new locations
Hurricane season is lengthening

They are then asked to develop more pointed questions that they can test. Some example questions for each hypothesis are given below:

Hypothesis 1 might lead to questions like "More hurricanes (or tropical storms) are forming each year" or "More hurricanes are striking land each year."
Hypothesis 2 might lead to questions such as "The maximum wind speed for hurricanes is increasing" or "The minimum barometric pressure is decreasing."
Hypothesis 3 might lead to questions like "Hurricanes are forming further north."
Hypothesis 4 might lead to questions such as "Hurricanes are forming earlier and later."

To answer these questions would require students to understand some background about hurricanes, like how many typically occur in the past (which leads to questions about data collection and observing hurricanes), how hurricane intensity is measured, or at what latitudes hurricanes typically form.

Then they are given a table or map data (derived from NOAA GIS data of hurricane tracks and intensity) to test their hypotheses.

The results of their inquiries and data collection will be shared with the class as parts of small groups initially, and will culminate as a small group presentation.

(Note: this resource was added to OER Commons as part of a batch upload of over 2,200 records. If you notice an issue with the quality of the metadata, please let us know by using the 'report' button and we will flag it for consideration.)

Subject:
Applied Science
Biology
Environmental Science
Life Science
Mathematics
Measurement and Data
Oceanography
Physical Science
Material Type:
Activity/Lab
Provider:
Science Education Resource Center (SERC) at Carleton College
Provider Set:
Teach the Earth
Author:
Chris Van de Ven
Date Added:
08/24/2019
Climate Change and Mammal Dispersal
Conditional Remix & Share Permitted
CC BY-NC-SA
Rating
0.0 stars

Students will learn how species shift along environmental gradients (temperature, precipitation, and vegetation) in response to climate change over the last 20,000 years, from the time of the Last Glacial Maximum through deglaciation and the Holocene. The activity involves making maps of species distribution using the Neotoma database. Students will develop skills in data analysis and interpretation over a two-to-four class arc.

(Note: this resource was added to OER Commons as part of a batch upload of over 2,200 records. If you notice an issue with the quality of the metadata, please let us know by using the 'report' button and we will flag it for consideration.)

Subject:
Applied Science
Biology
Environmental Science
History
Information Science
Life Science
Mathematics
Measurement and Data
Material Type:
Activity/Lab
Provider:
Science Education Resource Center (SERC) at Carleton College
Provider Set:
Teach the Earth
Author:
Suzanne Pilaar Birch
Date Added:
03/25/2021
Coke vs. Pepsi Taste Test: Experiments and Inference about Cause
Conditional Remix & Share Permitted
CC BY-NC-SA
Rating
0.0 stars

The Coke vs. Pepsi Taste Test Challenge has students design and carry out an experiment to determine whether or not students are able to correctly identify two brands of cola in a blind taste test.In the first stage of the activity students design and conduct the experiment. In the second part of the activity students use Sampling SIM software (freely downloadable from http://www.tc.umn.edu/~delma001/stat_tools/) to simulate and gather information on what would be expected under chance conditions (i.e., if students obtained correct answers only by guessing). The students then compare the observed results to the chance results and make an inference about whether a given student can in fact correctly identify Coke and Pepsi in a blind taste test. Finally, the experiment is critiqued in terms of how well it met the standards for a good experiment.

This activity allows students to gain a better understanding of the experimental process and causality through considering control, random assignment, and possible confounding variables. The activity also allows students to begin to understand the process of hypothesis testing by comparing their observed results of the taste test to the results obtained through Sampling SIM (which model would be obtained by chance). Students make an inference about whether particular students in their class can truly tell the difference between Coke and Pepsi by reasoning about how surprising the observed results are compared to the simulated distribution of correct identifications by guessing. The activity also provides an opportunity for discussing generalizability to a population.

Subject:
Mathematics
Measurement and Data
Statistics and Probability
Material Type:
Activity/Lab
Data Set
Provider:
Science Education Resource Center (SERC) at Carleton College
Provider Set:
Teach the Earth
Author:
Joan Garfield
Date Added:
11/06/2014
Comparing Climate Records from Multiple Locations
Conditional Remix & Share Permitted
CC BY-NC-SA
Rating
0.0 stars

This activity applies to Teaching Principle 2: Climate is regulated by complex interactions among components of the Earth System. It specifically addresses Concept 2A: Earth's climate is influenced by interactions involving the sun, ocean, atmosphere, clouds, ice, land, and life. Climate varies by region as a result of local differences in these interactions. It is anticipated that the activity will take two 50 - 75 minute class periods with additional time for follow-up assessment.
Students use web resources to identify climate patterns and distributions and
synthesize the information to develop an understanding of the global variation.

Students develop tables of temperature and precipitation averages and also identify and describe an extreme weather event. This exercise is an inquiry-style lesson and can easily be adapted for use in or out of the classroom.

Note: Prior to this assignment, students should receive some information on how to sample climate data from the GLOBE or NASA sets, or how to find quality online resources about climate and climate variability. This could be done as a walk-through, in-class tutorial of government/ university research centers and SERC sites, comparing the information in each to less reliable sources such as Wikipedia.

(Note: this resource was added to OER Commons as part of a batch upload of over 2,200 records. If you notice an issue with the quality of the metadata, please let us know by using the 'report' button and we will flag it for consideration.)
Subject:
Applied Science
Biology
Environmental Science
Life Science
Mathematics
Measurement and Data
Statistics and Probability
Material Type:
Activity/Lab
Provider:
Science Education Resource Center (SERC) at Carleton College
Provider Set:
Teach the Earth
Author:
Beth Christensen
Date Added:
09/15/2022
Comparing Stream Discharge in Two Watersheds in Glacier National Park
Conditional Remix & Share Permitted
CC BY-NC-SA
Rating
0.0 stars

Spreadsheets Across the Curriculum module/Geology of National Parks course. Students study how discharge per unit area varies with elevation in the high country of Glacier National Park from USGS hydrograph data from Swiftcurrent Creek and its tributary Grinnell Creek..

(Note: this resource was added to OER Commons as part of a batch upload of over 2,200 records. If you notice an issue with the quality of the metadata, please let us know by using the 'report' button and we will flag it for consideration.)
Subject:
Biology
Life Science
Mathematics
Measurement and Data
Statistics and Probability
Material Type:
Activity/Lab
Provider:
Science Education Resource Center (SERC) at Carleton College
Provider Set:
Teach the Earth
Author:
Module by: Mark Rains, University of South Florida Cover Page by: Len Vacher and Denise Davis, University of South Florida
Date Added:
12/29/2020
Confirmation of the IPCC Prediction re: Increased Storminess
Conditional Remix & Share Permitted
CC BY-NC-SA
Rating
0.0 stars

This activity represents a culmination project for this unit by means of which students can assess whether the IPCC prediction of increased storminess as an outcome of global warming survives testing. For the previous three weeks students will have conducted several inquiry-based group activities designed to introduce and reinforce fundamental meteorology/climatology concepts. In this 2-day project, students access online AVHRR SST imagery, as well as tabulated numeric data regarding historical North American tropical cyclones, import data into Excel for interpretation and analysis, and submit two group reports.

(Note: this resource was added to OER Commons as part of a batch upload of over 2,200 records. If you notice an issue with the quality of the metadata, please let us know by using the 'report' button and we will flag it for consideration.)
Subject:
Applied Science
Biology
Environmental Science
Life Science
Mathematics
Measurement and Data
Oceanography
Physical Science
Statistics and Probability
Material Type:
Activity/Lab
Provider:
Science Education Resource Center (SERC) at Carleton College
Provider Set:
Teach the Earth
Author:
Robert Kuhlman
Date Added:
08/21/2020
Consequences of Modern Energy Use: A Remote Sensing analysis of the gulf oil spill using ArcGIS software.
Conditional Remix & Share Permitted
CC BY-NC-SA
Rating
0.0 stars

This laboratory activity takes place in a computer lab that is equipped with ArcGIS (we are currently using ArcGIS 9.3). Students will go to NASA's oil spill gallery website and download the full size image of the Deepwater Horizon oil slick from July 14th, 2010 taken by the Moderate Resolution Imaging Spectroradiometer (MODIS) on NASA's Aqua satellite at 1:55 p.m. Central Daylight Time. Their task is to to analyze the satellite imagery as an RGB composite and to experiment with reclassification techniques to subdivide the continuous raster dataset into user-defined numbers of ranges that will help visualize the oil spill. The activity introduces students to GIS software, remote sensing analysis, and sets up questions on spatial patterns and consequences of energy use.

(Note: this resource was added to OER Commons as part of a batch upload of over 2,200 records. If you notice an issue with the quality of the metadata, please let us know by using the 'report' button and we will flag it for consideration.)
Subject:
Biology
Chemistry
Life Science
Mathematics
Measurement and Data
Oceanography
Physical Science
Material Type:
Activity/Lab
Provider:
Science Education Resource Center (SERC) at Carleton College
Provider Set:
Teach the Earth
Author:
Jared Beeton
Date Added:
08/27/2019
Continental Crust Mass Balance Calculation
Conditional Remix & Share Permitted
CC BY-NC-SA
Rating
0.0 stars

A quantitative skills-intensive exercise using data from the Mineral Mountains, Utah, to calculate mass balance and to address the "space problem" involved with emplacing plutons into the crust.

(Note: this resource was added to OER Commons as part of a batch upload of over 2,200 records. If you notice an issue with the quality of the metadata, please let us know by using the 'report' button and we will flag it for consideration.)

Subject:
Biology
Chemistry
Geology
Geoscience
Life Science
Mathematics
Measurement and Data
Physical Science
Statistics and Probability
Material Type:
Activity/Lab
Provider:
Science Education Resource Center (SERC) at Carleton College
Provider Set:
Teach the Earth
Author:
Jennifer Wenner
Date Added:
08/23/2019
Contractional Strain
Conditional Remix & Share Permitted
CC BY-NC-SA
Rating
0.0 stars

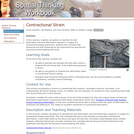
Students use gesture to describe the bulk deformation and local deformation apparent in images of a contractional analog experiment. Students then calculate bulk shortening and bulk thickening for the experiment and describe the structures accommodating that strain.

(Note: this resource was added to OER Commons as part of a batch upload of over 2,200 records. If you notice an issue with the quality of the metadata, please let us know by using the 'report' button and we will flag it for consideration.)

Subject:
Biology
Geoscience
Life Science
Mathematics
Measurement and Data
Physical Science
Statistics and Probability
Material Type:
Activity/Lab
Provider:
Science Education Resource Center (SERC) at Carleton College
Provider Set:
Teach the Earth
Author:
Carol Ormand
Date Added:
09/01/2022
Converging Tectonic Plates Demonstration
Conditional Remix & Share Permitted
CC BY-NC-SA
Rating
0.0 stars

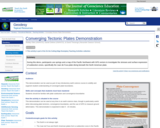
During this demo, participants use springs and a map of the Pacific Northwest with GPS vectors to investigate the stresses and surface expression of subduction zones, specifically the Juan de Fuca plate diving beneath the North American plate.

(Note: this resource was added to OER Commons as part of a batch upload of over 2,200 records. If you notice an issue with the quality of the metadata, please let us know by using the 'report' button and we will flag it for consideration.)
Subject:
Biology
Life Science
Mathematics
Measurement and Data
Statistics and Probability
Material Type:
Activity/Lab
Homework/Assignment
Provider:
Science Education Resource Center (SERC) at Carleton College
Provider Set:
Teach the Earth
Author:
Shelley Olds
Date Added:
08/27/2022
The Costs of Your Commute: Your Money, Your Time, and the Earth
Conditional Remix & Share Permitted
CC BY-NC-SA
Rating
0.0 stars

This activity has students investigate their own cost, CO2 output, and time for commuting. They then compare their commute to an environmentally conscious alternative by using comparable metrics.

(Note: this resource was added to OER Commons as part of a batch upload of over 2,200 records. If you notice an issue with the quality of the metadata, please let us know by using the 'report' button and we will flag it for consideration.)
Subject:
Applied Science
Biology
Environmental Science
Life Science
Mathematics
Measurement and Data
Statistics and Probability
Material Type:
Activity/Lab
Provider:
Science Education Resource Center (SERC) at Carleton College
Provider Set:
Teach the Earth
Author:
Charlie Buehrle
Date Added:
04/17/2018
Cracking and Crumbling: Exploring Mechanisms of Dike Emplacement
Conditional Remix & Share Permitted
CC BY-NC-SA
Rating
0.0 stars

This case study is based on exercises developed by Dave Pollard and uses images and mapping from Delaney and Pollard (1981). Students explore mechanisms of dike emplacement by measuring dike thicknesses along two segments of a dike intruded into shale near Ship Rock, New Mexico and mapped by Paul Delaney. Students then compare the observed dike profiles to a mechanical model -- the solution for a crack filled with magma under uniform pressure. Using the equation for opening of the crack students estimate the driving stress (difference between the magma pressure and remote principal stress acting perpendicular to the dike plane) using several different estimates of the rock stiffness parameters. Students are then asked to observe how well their best-fit model fits the two dike profiles and to investigate the map further and hypothesize why the observed widths may deviate from the simple model. Deviations from the mechanical model can lead to discussions on mechanical interaction as well as brecciation and stoping.

(Note: this resource was added to OER Commons as part of a batch upload of over 2,200 records. If you notice an issue with the quality of the metadata, please let us know by using the 'report' button and we will flag it for consideration.)
Subject:
Biology
Life Science
Mathematics
Measurement and Data
Statistics and Probability
Material Type:
Activity/Lab
Case Study
Provider:
Science Education Resource Center (SERC) at Carleton College
Provider Set:
Teach the Earth
Author:
Phil Resor
Date Added:
08/18/2019
Creating Personalized Maps with Google My Maps
Conditional Remix & Share Permitted
CC BY-NC-SA
Rating
0.0 stars

This activity focuses on one of the many free web mapping applications available: Google My Maps. Here you will learn how to create your own personalized maps in Google My Maps, complete with linked photographs and YouTube videos. The applications are endless: from your local running/biking routes to a map of your field area, complete with sample locations, sample data, and photographs. You can easily share your map with the rest of the world!

Subject:
Education
Educational Technology
Mathematics
Measurement and Data
Material Type:
Activity/Lab
Homework/Assignment
Provider:
Science Education Resource Center (SERC) at Carleton College
Provider Set:
Teach the Earth
Author:
Carsten Braun
Date Added:
01/20/2023
Creating and Analyzing Folds in Visible Geology
Conditional Remix & Share Permitted
CC BY-NC-SA
Rating
0.0 stars

This activity utilizes Visible Geology to analyze folds on a stereonet using a pi-girdle technique. The assignment starts with students following a simple example, and then creating their own and sharing it with a partner. Students are introduced to concepts of fold axis, axial plane, interlimb angle in three-visualizations: model view, cross-section view, and stereonet view. By moving between these media students are able to draw deeper connections with respect to folding and to stereonet interpretation.

(Note: this resource was added to OER Commons as part of a batch upload of over 2,200 records. If you notice an issue with the quality of the metadata, please let us know by using the 'report' button and we will flag it for consideration.)

Subject:
Biology
Life Science
Mathematics
Measurement and Data
Statistics and Probability
Material Type:
Activity/Lab
Provider:
Science Education Resource Center (SERC) at Carleton College
Provider Set:
Teach the Earth
Author:
Rowan Cockett
Date Added:
09/30/2022
Critiquing Crummy Maps
Conditional Remix & Share Permitted
CC BY-NC-SA
Rating
0.0 stars

Students are given a printout of several not very good maps and asked to critique them as a group. The maps are then projected at the front of the room one at a time and each group contributes their ideas.

Subject:
Education
Educational Technology
Mathematics
Measurement and Data
Material Type:
Activity/Lab
Provider:
Science Education Resource Center (SERC) at Carleton College
Provider Set:
Teach the Earth
Author:
Emily Burns
Date Added:
01/20/2023
Cyber-mapping for Teaching Undergraduate Geosciences Courses
Conditional Remix & Share Permitted
CC BY-NC-SA
Rating
0.0 stars

To prepare to these labs, students will attend discussions on describing the geometry of geological structures, strain analysis and geological cross-sections.

(Note: this resource was added to OER Commons as part of a batch upload of over 2,200 records. If you notice an issue with the quality of the metadata, please let us know by using the 'report' button and we will flag it for consideration.)
Subject:
Biology
Life Science
Mathematics
Measurement and Data
Material Type:
Activity/Lab
Provider:
Science Education Resource Center (SERC) at Carleton College
Provider Set:
Teach the Earth
Author:
Mohamed Abdelsalam
Date Added:
05/27/2020