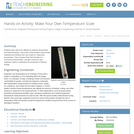
Students learn about the difference between temperature and thermal energy. They build …
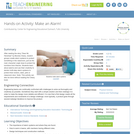
Students learn about the difference between temperature and thermal energy. They build a thermometer using simple materials and develop their own scale for measuring temperature. They compare their thermometer to a commercial thermometer, and get a sense for why engineers need to understand the properties of thermal energy.
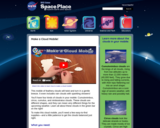
This mobile of feathery clouds will twist and turn in a gentle …
This mobile of feathery clouds will twist and turn in a gentle breeze. It even includes rain clouds with sparkling showers!
You’ll have four kinds of clouds in your mobile: Cumulonimbus, cirrus, cumulus, and nimbostratus clouds. These clouds are different shapes, and they can mean very different things for the upcoming weather. Learn all about these clouds in the green bar on the right!
To make this cloud mobile, you’ll need a few easy-to-find supplies—and a little patience to get the clouds balanced just right.
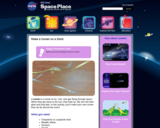
A comet is a chunk of ice, rock, and gas flying through …
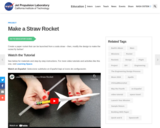
A comet is a chunk of ice, rock, and gas flying through space. When they get close to the sun, they heat up. We can see their glow and long tails. In this activity, you’ll make your own comet that can fly around the room!
After reading the story "Dear Mr. Henshaw" by Beverly Cleary, student groups …
After reading the story "Dear Mr. Henshaw" by Beverly Cleary, student groups create alarm systems to protect something in the classroom, just as the main character Leigh does to protect his lunchbox from thieves. Students learn about alarms and use their creativity to devise multi-step alarm systems to protect their lockers, desk, pets or classroom door. Note: This activity can also be done without reading the Cleary book.
It’s hard to imagine life on Earth without oceans. The air you …
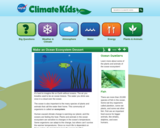
It’s hard to imagine life on Earth without oceans. The air you breathe used to be an ocean breeze. The water you drink was once in a cloud over the ocean.
The ocean is also important to the many species of plants and animals that call the water their home. This community of organisms is called an ecosystem.
Human-caused climate change is warming our planet, and the oceans are feeling the heat. Plants and animals in the ocean ecosystem are sensitive to changes in the ocean’s temperature. Some organisms can adapt to the change, but others can’t survive the warmer temperatures. Since so much life is dependent on these waters, it’s important to keep the oceans healthy!
Scientists are monitoring the temperature of the ocean with an instrument called the Moderate Resolution Imaging Spectroradiometer (MODIS) on NASA’s Aqua satellite. The satellite measures the temperature of the top millimeter of the ocean’s surface.
With this activity, learn to make a cool and tasty version of the ocean ecosystem at home!
NASA Space Crafts helps you learn to make paper airplanes. Print the …
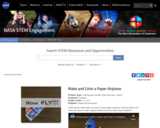
NASA Space Crafts helps you learn to make paper airplanes. Print the pattern and watch the video to make a paper airplane and learn about NASA airplanes.
Maker Clubs introduce students to the making movement, the idea that hands …
Maker Clubs introduce students to the making movement, the idea that hands on learning and creating things from scratch lays the foundation for future success, especially in STEM fields.
Students learn the components of the rock cycle and how rocks can …
Students learn the components of the rock cycle and how rocks can change over time under the influence of weathering, erosion, pressure and heat. They learn about geotechnical engineering and the role these engineers play in the development of an area of land, the design and placement of new structures, and detection of natural disasters.
Students use everyday building materials sand, pea gravel, cement and water to …
Students use everyday building materials sand, pea gravel, cement and water to create and test pervious pavement. They learn what materials make up a traditional, impervious concrete mix and how pervious pavement mixes differ. Groups are challenged to create their own pervious pavement mixes, experimenting with material ratios to evaluate how infiltration rates change with different mix combinations.
Students create large-scale models of microfluidic devices using a process similar to …
Students create large-scale models of microfluidic devices using a process similar to that of the PDMS and plasma bonding that is used in the creation of lab-on-a-chip devices. They use disposable foam plates, plastic bendable straws and gelatin dessert mix. After the molds have hardened overnight, they use plastic syringes to inject their model devices with colored fluid to test various flow rates. From what they learn, students are able to answer the challenge question presented in lesson 1 of this unit by writing individual explanation statements.
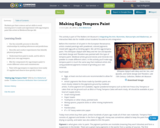
As a weighted plastic egg is dropped into a tub of flour, …
As a weighted plastic egg is dropped into a tub of flour, students see the effect that different heights and masses of the same object have on the overall energy of that object while observing a classic example of potential (stored) energy transferred to kinetic energy (motion). The plastic egg's mass is altered by adding pennies inside it. Because the egg's shape remains constant, and only the mass and height are varied, students can directly visualize how these factors influence the amounts of energy that the eggs carry for each experiment, verified by measurement of the resulting impact craters. Students learn the equations for kinetic and potential energy and then make predictions about the depths of the resulting craters for drops of different masses and heights. They collect and graph their data, comparing it to their predictions, and verifying the relationships described by the equations. This classroom demonstration is also suitable as a small group activity.
Graph theory is a visual way to represent relationships between objects. One …
Graph theory is a visual way to represent relationships between objects. One of the simplest uses of graph theory is a family tree that shows how different people are related. Another application is social networks like Facebook, where a network of "friends" and their "friends" can be represented using graphs. Students learn and apply concepts and methods of graph theory to analyze data for different relationships such as friendships and physical proximity. They are asked about relationships between people and how those relationships can be illustrated. As part of the lesson, students are challenged to find the social graph of their friends. This prepares students for the associated activity during which they simulate and analyze the spread of disease using graph theory by assuming close proximity to an infected individual causes the disease to spread.
This class is a global survey of the great transformation in history …
This class is a global survey of the great transformation in history known as the "Industrial Revolution." Topics include origins of mechanized production, the factory system, steam propulsion, electrification, mass communications, mass production and automation. Emphasis on the transfer of technology and its many adaptations around the world. Countries treated include Great Britain, France, Germany, the US, Sweden, Russia, Japan, China, and India. Includes brief reflection papers and a final paper.
No restrictions on your remixing, redistributing, or making derivative works. Give credit to the author, as required.
Your remixing, redistributing, or making derivatives works comes with some restrictions, including how it is shared.
Your redistributing comes with some restrictions. Do not remix or make derivative works.
Most restrictive license type. Prohibits most uses, sharing, and any changes.
Copyrighted materials, available under Fair Use and the TEACH Act for US-based educators, or other custom arrangements. Go to the resource provider to see their individual restrictions.