Citizen scientist Anya, an indigenous Siberian girl, witnesses the changes in her …
Citizen scientist Anya, an indigenous Siberian girl, witnesses the changes in her community as a result of climate change after working with Woods Hole scientist Max Holmes' research team aboard her father's ship. She gets involved in collecting water samples to learn, and teach her schoolmates about, global warming.
Living Atlas Indicators of the Planet provide the user with up-to-date data, …
Living Atlas Indicators of the Planet provide the user with up-to-date data, maps, graphs, charts, animation and other visuals to explore the science of climate and environmental change. 18 indicators from Air Quality to Women in Parliament can be explored.
This video, along with a background essay, focuses on impacts of climate …
This video, along with a background essay, focuses on impacts of climate change on the lives of Native Alaskans around Barrow, Alaska. Specific changes include the timing of the changes in the formation and breakout of sea ice and the impacts on subsistence living.
In this audio slideshow, an ecologist from the University of Florida describes …
In this audio slideshow, an ecologist from the University of Florida describes the radiocarbon dating technique that scientists use to determine the amount of carbon within the permafrost of the Arctic tundra. Understanding the rate of carbon released as permafrost thaws is necessary to understand how this positive feedback mechanism is contributing to climate change that may further increase global surface temperatures.
In this short video, host Dr. Ryan interviews graduate student Amy Steiker …
In this short video, host Dr. Ryan interviews graduate student Amy Steiker at the Institute of Arctic and Alpine Research about her research, using isotopes of nitrous oxide, connecting human activity to greenhouse gas emissions.
This activity engages students in learning about ways to become energy efficient …
This activity engages students in learning about ways to become energy efficient consumers. Students examine how different countries and regions around the world use energy over time, as reflected in night light levels. They then track their own energy use, identify ways to reduce their individual energy consumption, and explore how community choices impact the carbon footprint.
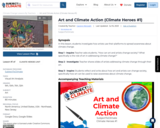
SYNOPSIS: In this lesson, students investigate how artists use their platforms to …
SYNOPSIS: In this lesson, students investigate how artists use their platforms to spread awareness about climate change.
SCIENTIST NOTES: This lesson encourages students to think about how artists and their art can be used to teach and inspire others about climate change. Many videos are included in the slideshow. Videos include one of Sarah Lewis, an art historian discussing how one person’s artwork can shift things, and a second one featuring “Earthrise,” a poem by Amanda Gorman, the youngest inaugural poet in U.S. history. There are an additional six videos covering artists and their artwork about climate change. This lesson finishes with great reflection questions and an opportunity for class discussion. This would be a great lesson for teaching the effects of art on the public perception of climate change.
POSITIVES: -Students consider the role of art as a form of climate activism. -Students are exposed to a variety of artists and types of art addressing climate change. -This lesson has significant cross-curricular possibilities, even though it focuses on art and artists. -Students begin to think about ways they might use artwork as a means of taking climate action.
ADDITIONAL PREREQUISITES: -This is lesson 1 of 3 in our 9th-12th grade Climate Heroes unit. -This lesson should follow a basic introduction to climate change science, exploration of global and local impacts, and climate change solutions. -Some prior knowledge of contemporary art practices is useful, but not required.
DIFFERENTIATION: -Teachers can provide instruction multimodally. -Teachers can modify the assignment and assessment as needed. -Teachers can follow up with questions to ensure comprehension. -Teachers can pair students with helpful peers.
SYNOPSIS: In this lesson, students evaluate three slogans on climate awareness and …
SYNOPSIS: In this lesson, students evaluate three slogans on climate awareness and advocacy and create their own artistic slogans with four specific types of parallel structure.
SCIENTIST NOTES: The lesson enables students to understand the intrinsic value of slogans in climate and social justice advocacy. Students would also practice how to use artistic slogans to communicate climate change impact to diverse audiences and policymakers in order to inform better decision-making and drive climate action. All materials have been carefully reviewed, and this lesson is recommended for teaching.
POSITIVES: -This lesson can be used in all levels of English and art classes. -Art teachers can use this lesson in any unit and incorporate other art components. -Students are given voice and choice in this lesson as they learn to manipulate language to achieve different outcomes. -This lesson can be used as an introduction to climate change and overall climate awareness. -This lesson can be added to a science lesson evaluating evidence for climate change or a communications or business lesson on marketing. -This lesson can be used to discuss climate justice in social studies.
ADDITIONAL PREREQUISITES: -Students should have some understanding of basic grammar and parallel structure. -Students should have an understanding of slogans and their purpose. -Students should have access to computers or art materials in order to create the final version of their parallel structure slogan.
DIFFERENTIATION: -Students’ use of language and vocabulary can be simple or complex in order to fit the needs of the class. -Teachers can simplify the lesson by focusing on only one or two forms of parallel structure. -Art teachers can have students design two different visual pieces to go with the same slogan, then compare and contrast the effects of the different artistic elements on the overall message. -Additional scaffolding for AP English classes can include a discussion on the purposes and effects of each specific form of parallel structure as well as an analysis of parallel structures in literature. -Teachers can connect the parallel structure skills in this lesson to their current reading material or curriculum. For example, students can identify forms of parallel structure in previously assigned class literature or nonfiction readings. -Teachers can extend this lesson into various writing activities for students to practice expository, analytical, descriptive, or narrative writing with different forms of parallel structure.
This article and slide show from the New York Times, features several …
This article and slide show from the New York Times, features several scientists from the University of Alaska, Fairbanks, who study the effects of thawing permafrost in Alaska.
Using Landsat 8 imagery from before and after the 2015 wildfire season …
Using Landsat 8 imagery from before and after the 2015 wildfire season in Glacier National Park, Montana, learners calculate the damage using a Normalized Burn Index, digitize the burn area, and publish to ArcGIS Online.
Stakeholders of the Morro Bay National Estuary Program in California worked with …
Stakeholders of the Morro Bay National Estuary Program in California worked with resources from the EPA's Climate Ready Estuaries program to identify their climate risks. Their results helped them prioritize actions for building resilience.
This easy-to-understand video animation describes drought and explains the different categories of …
This easy-to-understand video animation describes drought and explains the different categories of drought used by the drought monitor. It discusses the effects of and contributions to drought, what the implications of the different drought levels are, and puts the drought maps into context to understand how the impacts vary geographically (e.g. drought in Nevada vs Kansas - one could affect tourism, the other agriculture). It also touches on how the development of maps/drought severity is determined and how it might vary geographically. The animation provides a basic overview of statistics and percentiles and the concept of '100 year events.'
An interactive map based on four decades of satellite images helps residents, …
An interactive map based on four decades of satellite images helps residents, resource managers, and stewards of the land anticipate and plan for coastal change.
In this activity, students explore the web-based U.S. Forest Service Climate Change …
In this activity, students explore the web-based U.S. Forest Service Climate Change Atlas to learn about projected climate changes in their state and how suitable habitat for tree and bird species is projected to change by 2100.
These graphs show carbon dioxide measurements at the Mauna Loa Observatory, Hawaii. …
These graphs show carbon dioxide measurements at the Mauna Loa Observatory, Hawaii. The graphs display recent measurements as well as historical long term measurements. The related website summarizes in graphs the recent monthly CO2, the full CO2 Record, the annual Mean CO2 Growth Rate, and gives links to detailed CO2 data for this location, which is one of the most important CO2 tracking sites in the world.
This is a multi-step activity that helps students measure, investigate, and understand …
This is a multi-step activity that helps students measure, investigate, and understand the increase in atmospheric CO2 and the utility of carbon offsets. It also enables students to understand that carbon offsets, through reforestation, are not sufficient to balance increases in atmospheric C02 concentration.
This is a figure from the 2007 IPCC Assessment Report 4 on …
This is a figure from the 2007 IPCC Assessment Report 4 on atmospheric concentrations of carbon dioxide, methane and nitrous oxide over the last 10,000 years (large panels) and since 1750 (inset panels).
No restrictions on your remixing, redistributing, or making derivative works. Give credit to the author, as required.
Your remixing, redistributing, or making derivatives works comes with some restrictions, including how it is shared.
Your redistributing comes with some restrictions. Do not remix or make derivative works.
Most restrictive license type. Prohibits most uses, sharing, and any changes.
Copyrighted materials, available under Fair Use and the TEACH Act for US-based educators, or other custom arrangements. Go to the resource provider to see their individual restrictions.