Updating search results...

Impact Measurement

This collection contains materials pertaining to scholarly metrics and scholarly identity, including traditional and alternative metrics, academic social media, and related issues.


32 affiliated resources

Search Resources

View
Selected filters:
Publishing Values-based Scholarly Communication
Unrestricted Use
CC BY
Rating
0.0 stars

The focus of this resource is primarily on the underrepresented area of publicly engaged scholarship. It addresses a wide range of MLIS students and LIS professionals based at universities, especially those whose mission explicitly encompasses engaged scholarship initiatives. The resource also spotlights publicly engaged publishing initiatives that provide examples of scholarly communications projects with social justice values such as equity, access, fairness, inclusivity, respect, ethics, and trust deeply embedded in their design. 

While examples shared in the first iteration of the resource will focus on model practices primarily in North America, the values-based nature of the resource will have global appeal. This resource describes the publishing challenges that publicly engaged scholars often encounter and offers a framework for tackling these challenges. Video interviews and insights are included to provide a range of viewpoints from scholars, advocates, and instructors.

Subject:
Applied Science
Information Science
Material Type:
Activity/Lab
Reading
Author:
Bonnie Russell
Catherine Cocks
Kath Burton
Date Added:
01/05/2023
Research Evaluation Metrics
Conditional Remix & Share Permitted
CC BY-SA
Rating
0.0 stars

This module dwells on a number of methods (including old and new) available for research evaluation. The module comprises the following four units:
Unit 1. Introduction to Research Evaluation Metrics and Related Indicators.
Unit 2. Innovations in Measuring Science and Scholarship: Analytical Tools and Indicators in Evaluation Scholarship Communications.
Unit 3. Article and Author Level Measurements, and
Unit 4. Online Citation and Reference Management Tools.
Brief overviews of the units are presented below.
Unit 1 encompassed and discussed citation analysis, use of citation-based indicators for research evaluation, common bibliometric indicators, classical bibliometric laws, author level indicators using authors' public profiles, article level metrics using altmetric tools. It is to be noted that author level indicators and article level metrics are new tools for research evaluation. Author level indicators encompasses h index, citations count, i10 index, g index, articles with citation, average citations per article, Eigenfactor score, impact points, and RG score. Article level metrics or altmetrics are based on Twitter, Facebook, Mendeley, CiteULike, and Delicious which have been discussed. All technical terms used in the Unit have been defined.
Unit 2 deals with analytical tools and indicators used in evaluating scholarly communications. The tools covered are The Web of Science, Scopus, Indian Citation Index (ICI), CiteSeerX, Google Scholar and Google Scholar Citations. Among these all the tools except Indian Citation Index (ICI) are international in scope. ICI is not very much known outside India. It is a powerful tool as far Indian scholarly literature is concerned. As Indian journals publish a sizable amount of foreign literature, the tool will be useful for foreign countries as well. The analytical products with journal performance metrics Journal Citation Reports (JCR®) has also been described. In the chapter titled New Platforms for Evaluating Scholarly Communications three websites i.e. SCImago Journal & Country Rank (SJR) [ScimagoJR.com], eigenFACTOR.org, JournalMetrics.com and one software called Publish or Perish (POP) Software have been discussed.
Article and author level measurements have been discussed in Unit 3. Author and researcher identifiers are absolutely essential for searching databases in the WWW because a name like D Singh can harbour a number of names such as Dan Singh, Dhan Singh, Dhyan Singh, Darbara Singh, Daulat Singh, Durlabh Singh and more. The ResearcherID.com, launched by Thomson Reuters, is a web-based global registry of authors and researchers that individualises each and every name. Open Researcher and Contributor ID (ORCID) is also a registry that uniquely identifies an author or researcher. Both have been discussed in this Unit. Article Level Metrics (Altmetrics) has been treated in this Unit with the discussion as to how altmetrics can be measured with Altmetric.com and ImpactStory.org. Altmetrics for Online Journals has also been touched. There are a number of academic social networks of which ResearchGate.net, Academia.edu, GetCited.org, etc. have been discussed. Regional journal networks with bibliometric indicators are also in existence. Two networks of this type such as SciELO – Scientific Electronic Library Online, and Redalyc have been dealt with.
The last unit (Unit 4) is on online citation and reference management tools. The tools discussed are Mendeley, CiteULike, Zotero, Google Scholar Library, and EndNote Basic. The features of all the management tools have been discussed with figures, tables, and text boxes.
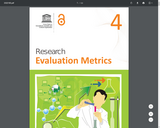
This is Module Four of the UNESCO's Open Access Curriculum for Researchers.
Full-Text is available at http://unesdoc.unesco.org/images/0023/002322/232210E.pdf

Subject:
Applied Science
Career and Technical Education
Education
Higher Education
Information Science
Material Type:
Full Course
Module
Textbook
Unit of Study
Author:
Anup Kumar Das
Date Added:
09/12/2018
Research Metric Source Cards
Unrestricted Use
CC BY
Rating
0.0 stars

These research metric source cards provide the citation for a scholarly work and the research metrics of that work, which can include: the Altmetric Attention Score, the scholarly citation counts from different data sources, and field-weighted citation indicators; in addition, abstracts and important context to some of the metrics is also included, e.g., citation statements, titles of select online mentions, such as news and blog article titles, Wikipedia pages, patent citations, and the context behind those online mentions. There are four printable source cards (front and back) followed by activity questions for each source card. These cards help students engage in and interrogate the meaning behind bibliometrics and altmetrics of specific scholarly works as well as evaluate the credibility, authority, and reliability of the scholarly work itself.

Subject:
Applied Science
Information Science
Material Type:
Activity/Lab
Homework/Assignment
Author:
Amanda MacDonald
Rachel Miles
Date Added:
03/08/2023
San Francisco Declaration on Research Assessment
Unrestricted Use
CC BY
Rating
0.0 stars

The Declaration on Research Assessment (DORA) recognizes the need to improve the ways in which the outputs of scholarly research are evaluated. The declaration was developed in 2012 during the Annual Meeting of the American Society for Cell Biology in San Francisco. It has become a worldwide initiative covering all scholarly disciplines and all key stakeholders including funders, publishers, professional societies, institutions, and researchers. The DORA initiative encourages all individuals and organizations who are interested in developing and promoting best practice in the assessment of scholarly research to sign DORA.

Other resources are available on their website, such as case studies of universities and national consortia that demonstrate key elements of institutional change to improve academic career success.

Subject:
Education
Higher Education
Material Type:
Reading
Author:
American Society for Cell Biology
Date Added:
04/20/2022
ScholCom202X: an interactive fiction game about being a scholarly communication librarian
Unrestricted Use
CC BY
Rating
0.0 stars

In ScholCom 202X, you'll take on the role of a new scholarly communication librarian at a small public university somewhere in the US in the "distant future" of the year 202X.

You'll be given a number of scenarios derived from activities and questions a real scholarly communication librarian might expect to receive. These scenarios fall into four general areas: copyright; publishing; institutional repositories; and open access.

The game has two versions, an interactive fiction format written in Ink (located in the "Ink source" and "playable" folders) and a static PDF version (in "printables").

In the interactive fiction version, after reading each scenario you'll be given a chance to consult your "augment," a smartphone-like device which contains a very brief annotated list of some relevant sources and a calendar that tracks how busy you are. In the PDF/print version, these sources are listed below the scenario text, and are open access whenever possible.

After you've read the scenario text and consulted these sources (or not), put yourself in the place of the librarian in the game and think about how you would respond. Would you try to help just the person you're currently talking to, or would you rather build resources and develop strategies that could make the question easier to answer the next time it comes up, and potentially even reach and educate people who don't know the questions to ask in the first place?

As you think through each scenario, ask yourself how you would balance the desire to do a good job against the threat of overwork. You're welcome to write out what you would do, or just think about it. The PDF versions of the scenarios can also be used to role play in a classroom setting, with one student taking on the role of the librarian and another the role of the person who needs their help.

Playable version at https://people.wou.edu/~bakersc/ScholCom202X/index.html. Additional background available at https://lisoer.wordpress.ncsu.edu/2021/05/18/new-to-the-scn-scholcom-202x-an-interactive-fiction-game/.

Subject:
Applied Science
Information Science
Material Type:
Game
Interactive
Simulation
Teaching/Learning Strategy
Author:
Stewart Baker
Date Added:
10/25/2021
Teaching Data Analysis in the Social Sciences: A case study with article level metrics
Conditional Remix & Share Permitted
CC BY-NC-SA
Rating
0.0 stars

This case study is retrieved from the open book Open Data as Open Educational Resources. Case studies of emerging practice.

Course description:

Metrics and measurement are important strategic tools for understanding the world around us. To take advantage of the possibilities they offer, however, one needs the ability to gather, work with, and analyse datasets, both big and small. This is why metrics and measurement feature in the seminar course Technology and Evolving Forms of Publishing, and why data analysis was a project option for the Technology Project course in Simon Fraser University’s Master of Publishing Program.

The assignment:

“Data Analysis with Google Refine and APIs": Pick a dataset and an API of your choice (Twitter, VPL, Biblioshare, CrossRef, etc.) and combine them using Google Refine. Clean and manipulate your data for analysis. The complexity/messiness of your data will be taken into account”.

Subject:
Applied Science
Information Science
Social Science
Sociology
Material Type:
Case Study
Author:
Alessandra Bordini
Juan Pablo Alperin
Katie Shamash
Date Added:
03/27/2019
Teaching Undergraduates to Collate and Evaluate News Sources with Altmetrics
Unrestricted Use
CC BY
Rating
0.0 stars

Book chapter from the book, "Teaching About Fake News: Lesson Plans for Different Disciplines and Audiences."

Abstract: In the digital age of information, undergraduate students often have a difficult time identifying and differentiating among online sources, such as news articles, blog posts, and academic articles. Students generally find these sources online and often struggle to vet them for consistency, context, quality, and validity. In this chapter, we present a new purpose for altmetrics in which librarians teach undergraduates to use altmetrics as a tool to evaluate and differentiate between online mainstream and scholarly sources, which can lead to a deeper understanding of the research process and the engagement and discussion surrounding research as well as an increased ability to evaluate sources more critically. On a more advanced level, students will be able to analyze different levels of inaccuracy and misrepresentation of research from mainstream sources and more accurately identify highly sensationalized research topics from mainstream sources, seminal works of research, and deliberately misleading information and/or fake news.

Subject:
Applied Science
Information Science
Material Type:
Lesson Plan
Reading
Teaching/Learning Strategy
Provider:
Virginia Tech
Provider Set:
VTech Works
Author:
Amanda B. MacDonald
Rachel A. Miles
Date Added:
03/10/2023
Understanding community-university knowledge exchange: A case study of the Making Research Accessible initiative (MRAi)
Conditional Remix & Share Permitted
CC BY-NC-SA
Rating
0.0 stars

The OER, consisting of an Instructor’s Guide and accompanying presentation Slide Deck with speaking notes, emphasizes three primary themes:
- Principles and practices of community engagement for knowledge exchange;
- Meaningful access to research for non-academic audiences;
- Research ethics in historically marginalized underrepresented communities.

We have organized the OER to consist of a “core” module, “Community-based knowledge exchange and mitigating information privilege” and three pathways: 1) “Information access and alternative formats,” 2) “Supporting community led research,” and 3) “Community engagement and services.” Instructors can “mix and match” content from the pathways depending on available class time, course structure, and student interests. The core and pathway modules include learning objectives, a wide selection of open access academic and professional articles, books, blogs, websites, videos and multimedia, and active learning activities for in-person or online delivery.

Subject:
Applied Science
Information Science
Material Type:
Case Study
Lesson
Lesson Plan
Module
Primary Source
Reading
Author:
Heather O'Brien
Luanne Sinnamon
Nick Ubels
Mandy Choie
Date Added:
04/13/2022
Using Altmetric Data Responsibly: A Guide to Interpretation and Good Practice
Unrestricted Use
CC BY
Rating
0.0 stars

This guide focuses specifically on data from the data provider and company, Altmetric, but other types of altmetrics are mentioned and occasionally used as a comparison in this guide, such as the Open Syllabus database to find the educational engagement with scholarly outputs. This guide opens with an introduction followed by an overview of Altmetric and the Altmetric Attention Score, Altmetrics and Responsible Research Assessment, Output Types Tracked by Altmetric, and the Altmetric Sources of Attention, which include: News and Mainstream Media, Social Media (X (formerly Twitter), Facebook, Reddit, and historical data from Google+, Pinterest, LinkedIn, and Sina Weibo); Patents, Peer Review, Syllabi (historical data only), Multimedia, Public Policy Documents, Wikipedia, Research Highlights, Reference Managers, and Blogs; finally, there is a conclusion, a list of related resources and readings, two appendices, and references. This guide is intended for use by librarians, practitioners, funders, and other users of Altmetric data or those who are interested in incorporating altmetrics into their bibliometric practice and/or research analytics. It can also help researchers who are going up for annual evaluations and promotion and tenure reviews, who can use the data in informed and practical applications. It can also be a useful reference guide for research managers and university administrators who want to understand the broader online engagement with research publications beyond traditional scholarly citations, also known as bibliometrics, but who also want to avoid misusing, misinterpreting, or abusing Altmetric data when making decisions, creating policies, and evaluating faculty members and researchers at their institutions.

Subject:
Applied Science
Education
Higher Education
Information Science
Material Type:
Reading
Provider:
Virginia Tech
Provider Set:
VTech Works
Author:
Rachel Miles
Robyn Price
Date Added:
12/04/2023
Using InCites responsibly: a guide to interpretation and good practice
Unrestricted Use
CC BY
Rating
0.0 stars

This guide has been created by bibliometric practitioners to support other users of InCites, a research analytics tool from Clarivate Analytics that uses bibliographic data from Web of Science; the guide promotes a community of informed and responsible use of research impact metrics. The recommendations in this document may be more suited to other academic sector users, but the authors hope that other users may also benefit from the suggestions. The guide aims to provide plain-English definitions, key strengths and weaknesses and some practical application tips for some of the most commonly-used indicators available in InCites. The indicator definitions are followed by explanations of the data that powers InCites, attempting to educate users on where the data comes from and how the choices made in selecting and filtering data will impact on final results. Also in this document are a comparative table to highlight differences between indicators in InCites and SciVal, another commonly used bibliometric analytic programme, and instructions on how to run group reports. All of the advice in this document is underpinned by a belief in the need to use InCites in a way that respects the limitations of indicators as quantitative assessors of research outputs. Both of the authors are members of signatory institutions of DORA, the San Francisco Declaration on Research Assessment. A summary of advice to using indicators and bibliometric data responsibly is available on pages 4-5 and should be referred to throughout. Readers are also recommended to refer to the official InCites Indicators Handbook produced by Clarivate Analytics. The guide was written with complete editorial independence from Clarivate Analytics, the owners of InCites. Clarivate Analytics supported the authors of this document with checking for factual accuracy only.

Subject:
Education
Higher Education
Material Type:
Reading
Author:
Gray A
Price R
Date Added:
05/09/2022
Using SciVal responsibly: a guide to interpretation and good practice
Conditional Remix & Share Permitted
CC BY-NC-SA
Rating
0.0 stars

This guide is designed to help those who use SciVal, a research analytics tool from Elsevier that sources bibliographic data from Scopus, to source and apply bibliometrics in academic institutions. It was originally devised in February 2018 by Dr. Ian Rowlands of King’s College London as a guide for his university, which makes SciVal widely available to its staff. King’s does this because it believes that bibliometric data are best used in context by specialists in the field. A small group of LIS-Bibliometrics committee members reviewed and revised the King’s guide to make it more applicable to a wider audience. SciVal is a continually updated source and so feedback is always welcome at LISBibliometrics@jiscmail.ac.uk. LIS-Bibliometrics is keen that bibliometric data should be used carefully and responsibly and this requires an understanding of the strengths and limitations of the indicators that SciVal publishes.

The purpose of this Guide is to help researchers and professional services staff to make the most meaningful use of SciVal. It includes some important `inside track’ insights and practical tips that may not be found elsewhere. The scope and coverage limitations of SciVal are fairly widely understood and serve as a reminder that these metrics are not appropriate in fields where scholarly communication takes place mainly outside of the journals and conference literature. This is one of the many judgment calls that need to be made when putting bibliometric data into their proper context. One of the most useful features of SciVal is the ability to drill down in detail using various filters. This allows a user to define a set of publications accurately, but that may mean generating top level measures that are based on small samples with considerable variance. Bibliometrics distributions are often highly skewed, where even apparently simple concepts like the `average’ can be problematic. So one objective of this Guide is to set out some advice on sample sizes and broad confidence intervals, to avoid over-interpreting the headline data. Bibliometric indicators should always be used in combination, not in isolation, because each can only offer partial insights. They should also be used in a 'variable geometry' along with other quantitative and qualitative indicators, including expert judgments and non-publication metrics, such as grants or awards, to flesh out the picture.

Subject:
Education
Higher Education
Material Type:
Reading
Author:
Elizabeth Gadd
Ian Rowlands
LIS-Bibliometrics Committee
Date Added:
05/09/2022
Who's Counting: An Introduction to Bibliometrics
Conditional Remix & Share Permitted
CC BY-NC-SA
Rating
0.0 stars

Presentation from a University of York Library workshop on bibliometrics. The session covers how published research outputs are measured at the article, author and journal level; with discussion of the limitations of a bibliometric approach.

Subject:
Applied Science
Business and Communication
Communication
Education
Higher Education
Information Science
Material Type:
Lecture
Author:
Lindsey Myers
Thom Blake
Date Added:
11/22/2020