This is a task from the Illustrative Mathematics website that is one …
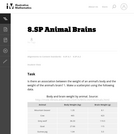
This is a task from the Illustrative Mathematics website that is one part of a complete illustration of the standard to which it is aligned. Each task has at least one solution and some commentary that addresses important asects of the task and its potential use. Here are the first few lines of the commentary for this task: Is there an association between the weight of an animal’s body and the weight of the animal’s brain? 1. Make a scatterplot using the following data. Bo...
This is a task from the Illustrative Mathematics website that is one …
This is a task from the Illustrative Mathematics website that is one part of a complete illustration of the standard to which it is aligned. Each task has at least one solution and some commentary that addresses important asects of the task and its potential use. Here are the first few lines of the commentary for this task: Jerry forgot to plug in his laptop before he went to bed. He wants to take the laptop to his friend's house with a full battery. The pictures below sho...
Students are introduced to measuring and identifying sources of air pollution, as …
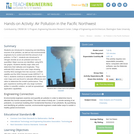
Students are introduced to measuring and identifying sources of air pollution, as well as how environmental engineers try to control and limit the amount of air pollution. In Part 1, students are introduced to nitrogen dioxide as an air pollutant and how it is quantified. Major sources are identified, using EPA bar graphs. Students identify major cities and determine their latitudes and longitudes. They estimate NO2 values from color maps showing monthly NO2 averages from two sources: a NASA satellite and the WSU forecast model AIRPACT. In Part 2, students continue to estimate NO2 values from color maps and use Excel to calculate differences and ratios to determine the model's performance. They gain experience working with very large numbers written in scientific notation, as well as spreadsheet application capabilities.
This task asks students to glean contextual information about bird eggs from …
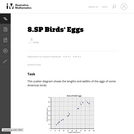
This task asks students to glean contextual information about bird eggs from a collection of measurements of said eggs organized in a scatter plot. In particular, students are asked to identify a correlation and use it to make interpolative predictions, and reason about the properties of specific eggs via the graphical presentation of the data.
Students design and conduct experiments to determine what environmental factors favor decomposition …
Students design and conduct experiments to determine what environmental factors favor decomposition by soil microbes. They use chunks of carrots for the materials to be decomposed, and their experiments are carried out in plastic bags filled with dirt. Every few days students remove the carrots from the dirt and weigh them. Depending on the experimental conditions, after a few weeks most of the carrots will have decomposed completely.
Students gain a basic understanding of the properties of media soil, sand, …
Students gain a basic understanding of the properties of media soil, sand, compost, gravel and how these materials affect the movement of water (infiltration/percolation) into and below the surface of the ground. They learn about permeability, porosity, particle size, surface area, capillary action, storage capacity and field capacity, and how the characteristics of the materials that compose the media layer ultimately affect the recharging of groundwater tables. They test each type of material, determining storage capacity, field capacity and infiltration rates, seeing the effect of media size on infiltration rate and storage. Then teams apply the testing results to the design their own material mixes that best meet the design requirements. To conclude, they talk about how engineers apply what students learned in the activity about the infiltration rates of different soil materials to the design of stormwater management systems.
Student groups are provided with a generic car base on which to …
Student groups are provided with a generic car base on which to design a device/enclosure to protect an egg on or in the car as it rolls down a ramp at increasing slopes. During this in-depth physics/science/technology activity, student teams design, build and test their creations to meet the design challenge, and are expected to perform basic mathematical calculations using collected data, including a summative cost to benefit ratio.
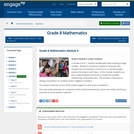
In Grades 6 and 7, students worked with data involving a single …
In Grades 6 and 7, students worked with data involving a single variable. Module 6 introduces students to bivariate data. Students are introduced to a function as a rule that assigns exactly one value to each input. In this module, students use their understanding of functions to model the possible relationships of bivariate data. This module is important in setting a foundation for students work in algebra in Grade 9.
Students learn about weight and drag forces by making paper helicopters and …
Students learn about weight and drag forces by making paper helicopters and measuring how adding more weight affects the time it takes for the helicopters to fall to the ground.
(Nota: Esta es una traducción de un recurso educativo abierto creado por …
(Nota: Esta es una traducción de un recurso educativo abierto creado por el Departamento de Educación del Estado de Nueva York (NYSED) como parte del proyecto "EngageNY" en 2013. Aunque el recurso real fue traducido por personas, la siguiente descripción se tradujo del inglés original usando Google Translate para ayudar a los usuarios potenciales a decidir si se adapta a sus necesidades y puede contener errores gramaticales o lingüísticos. La descripción original en inglés también se proporciona a continuación.)
En los grados 6 y 7, los estudiantes trabajaron con datos que involucraban una sola variable. El módulo 6 presenta a los estudiantes a bivariando datos. Los estudiantes se introducen a una función como una regla que asigna exactamente un valor a cada entrada. En este módulo, los estudiantes usan su comprensión de las funciones para modelar las posibles relaciones de datos bivariados. Este módulo es importante para establecer una base para los estudiantes que trabajan en álgebra en el grado 9.
English Description: In Grades 6 and 7, students worked with data involving a single variable. Module 6 introduces students to bivariate data. Students are introduced to a function as a rule that assigns exactly one value to each input. In this module, students use their understanding of functions to model the possible relationships of bivariate data. This module is important in setting a foundation for students work in algebra in Grade 9.
The intent of clarifying statements is to provide additional guidance for educators …
The intent of clarifying statements is to provide additional guidance for educators to communicate the intent of the standard to support the future development of curricular resources and assessments aligned to the 2021 math standards. Clarifying statements can be in the form of succinct sentences or paragraphs that attend to one of four types of clarifications: (1) Student Experiences; (2) Examples; (3) Boundaries; and (4) Connection to Math Practices.
Students learn about two types of friction static and kinetic and the …
Students learn about two types of friction static and kinetic and the equation that governs them. They also measure the coefficient of static friction experimentally.
This problem-based learning module is students will be collecting their personal health …
This problem-based learning module is students will be collecting their personal health numbers in a station rotation format. After choosing their health numbers to compare, the students will create a scatter plot and line of best fit using class data. Students will do a gallery walk to compare their health numbers with their peers. The students will then create a presentation for a health fair to bring awareness to health numbers based on their personal findings and facts.
No restrictions on your remixing, redistributing, or making derivative works. Give credit to the author, as required.
Your remixing, redistributing, or making derivatives works comes with some restrictions, including how it is shared.
Your redistributing comes with some restrictions. Do not remix or make derivative works.
Most restrictive license type. Prohibits most uses, sharing, and any changes.
Copyrighted materials, available under Fair Use and the TEACH Act for US-based educators, or other custom arrangements. Go to the resource provider to see their individual restrictions.