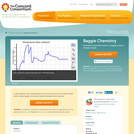
In this experiment, two chemicals that can be found around the house …
In this experiment, two chemicals that can be found around the house will be mixed within a plastic baggie, and several chemical changes will be observed.
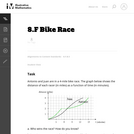
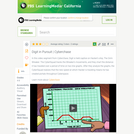
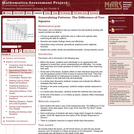
The purpose of this task is for students to interpret two distance-time …
The purpose of this task is for students to interpret two distance-time graphs in terms of the context of a bicycle race. There are two major mathematical aspects to this: interpreting what a particular point on the graph means in terms of the context, and understanding that the "steepness" of the graph tells us something about how fast the bicyclists are moving.
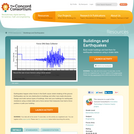
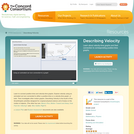
Earthquakes happen when forces in the Earth cause violent shaking of the …
Earthquakes happen when forces in the Earth cause violent shaking of the ground. Earthquakes can be very destructive to buildings and other man-made structures. Design and build various types of buildings, then test your buildings for earthquake resistance using a shake table and a force sensor that measures how hard a force pushes or pulls your building.
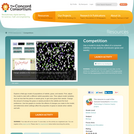
Explore a NetLogo model of populations of rabbits, grass, and weeds. First, …
Explore a NetLogo model of populations of rabbits, grass, and weeds. First, adjust the model to start with a different rabbit population size. Then adjust model variables, such as how fast the plants or weeds grow, to get more grass than weeds. Change the amount of energy the grass or weeds provide to the rabbits and the food preference. Use line graphs to monitor the effects of changes you make to the model, and determine which settings affect the proportion of grass to weeds when rabbits eat both.
Learn to connect position-time and velocity-time graphs. Explore velocity using an animated …
Learn to connect position-time and velocity-time graphs. Explore velocity using an animated car icon connected to either a position-time or a velocity-time graph, or both. Then investigate other motion graphs.
Determine the dew point temperature for your classroom through a hands-on experiment. …
Determine the dew point temperature for your classroom through a hands-on experiment. Use humidity and temperature probes to investigate the temperature at which it would rain in your classroom! Learn about water density and the conditions necessary to produce fog or rain.
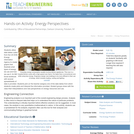
Students utilize data tables culled from the US DOE Energy Information Agency …
Students utilize data tables culled from the US DOE Energy Information Agency to create graphs that illustrate what types of energy we use and how we use it. An MS Excel workbook with several spreadsheets of data is provided. Students pick (or the teacher assigns) one of the data tables from which students create plots and interpret the information provided. Student groups share with the class their interpretations and new perspectives on energy resources and use.
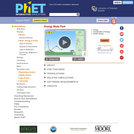
Learn about conservation of energy with a skater dude! Build tracks, ramps …
Learn about conservation of energy with a skater dude! Build tracks, ramps and jumps for the skater and view the kinetic energy, potential energy and friction as he moves. You can also take the skater to different planets or even space!
Students experiment with an online virtual laboratory set at a skate park. …
Students experiment with an online virtual laboratory set at a skate park. They make predictions of graphs before they use the simulation to create graphs of energy vs. time under different conditions. This simulation experimentation strengths their comprehension of conservation of energy solely between gravitational potential energy and kinetic energy
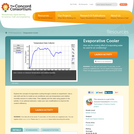
Explore the concept of evaporative cooling through a hands-on experiment. Use a …
Explore the concept of evaporative cooling through a hands-on experiment. Use a wet cloth and fan to model an air-conditioner and use temperature and relative humidity sensors to collect data. Then digitally plot the data using graphs in the activity. In an optional extension, make your own modifications to improve the cooler's efficiency.
This lesson unit is intended to help you assess how well students …
This lesson unit is intended to help you assess how well students working with square numbers are able to: choose an appropriate, systematic way to collect and organize data, examining the data for patterns; describe and explain findings clearly and effectively; generalize using numerical, geometrical, graphical and/or algebraic structure; and explain why certain results are possible/impossible, moving towards a proof.
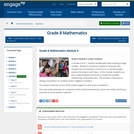
In Grades 6 and 7, students worked with data involving a single …
In Grades 6 and 7, students worked with data involving a single variable. Module 6 introduces students to bivariate data. Students are introduced to a function as a rule that assigns exactly one value to each input. In this module, students use their understanding of functions to model the possible relationships of bivariate data. This module is important in setting a foundation for students work in algebra in Grade 9.
Build your own miniature "greenhouse" out of a plastic container and plastic …
Build your own miniature "greenhouse" out of a plastic container and plastic wrap, and fill it with different things such as dirt and sand to observe the effect this has on temperature. Monitor the temperature using temperature probes and digitally plot the data on the graphs provided in the activity.
Explore how the Earth's atmosphere affects the energy balance between incoming and …
Explore how the Earth's atmosphere affects the energy balance between incoming and outgoing radiation. Using an interactive model, adjust realistic parameters such as how many clouds are present or how much carbon dioxide is in the air, and watch how these factors affect the global temperature.
Discover how electricity can be converted into other forms of energy such …
Discover how electricity can be converted into other forms of energy such as light and heat. Connect resistors and holiday light bulbs to simple circuits and monitor the temperature over time. Investigate the differences in temperature between the circuit with the resistor and the circuit using the bulb.
No restrictions on your remixing, redistributing, or making derivative works. Give credit to the author, as required.
Your remixing, redistributing, or making derivatives works comes with some restrictions, including how it is shared.
Your redistributing comes with some restrictions. Do not remix or make derivative works.
Most restrictive license type. Prohibits most uses, sharing, and any changes.
Copyrighted materials, available under Fair Use and the TEACH Act for US-based educators, or other custom arrangements. Go to the resource provider to see their individual restrictions.