This is a task from the Illustrative Mathematics website that is one …
This is a task from the Illustrative Mathematics website that is one part of a complete illustration of the standard to which it is aligned. Each task has at least one solution and some commentary that addresses important asects of the task and its potential use. Here are the first few lines of the commentary for this task: A penny is about $\frac{1}{16}$ of an inch thick. In 2011 there were approximately 5 billion pennies minted. If all of these pennies were placed in a s...
This is a task from the Illustrative Mathematics website that is one …
This is a task from the Illustrative Mathematics website that is one part of a complete illustration of the standard to which it is aligned. Each task has at least one solution and some commentary that addresses important aspects of the task and its potential use.
Introduce elementary students to the concept of functions by investigating growing patterns. …
Introduce elementary students to the concept of functions by investigating growing patterns. Visual patterns formed with manipulatives are especially effective for elementary students and allow them to concretely build understanding as they first reproduce, then extend the pattern to the next couple of stages.
This a a cross curricular unit encompassing English, History, and Math Common …
This a a cross curricular unit encompassing English, History, and Math Common Core Standards to teach the Child Labor practices of 1800s U.S. with the tragedy of Triangle Shirtwaist Factory Fire of 1911 which lead to child labor reform throughout the world and into the modern era.
There is a natural (and complicated!) predator-prey relationship between the fox and …
There is a natural (and complicated!) predator-prey relationship between the fox and rabbit populations, since foxes thrive in the presence of rabbits, and rabbits thrive in the absence of foxes. However, this relationship, as shown in the given table of values, cannot possibly be used to present either population as a function of the other. This task emphasizes the importance of the "every input has exactly one output" clause in the definition of a function, which is violated in the table of values of the two populations.
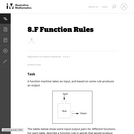
This task can be played as a game where students have to …
This task can be played as a game where students have to guess the rule and the instructor gives more and more input output pairs. Giving only three input output pairs might not be enough to clarify the rule.
This lesson unit is intended to help you assess how well students …
This lesson unit is intended to help you assess how well students working with square numbers are able to: choose an appropriate, systematic way to collect and organize data, examining the data for patterns; describe and explain findings clearly and effectively; generalize using numerical, geometrical, graphical and/or algebraic structure; and explain why certain results are possible/impossible, moving towards a proof.
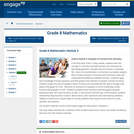
In the first topic of this 15 day module, students learn the …
In the first topic of this 15 day module, students learn the concept of a function and why functions are necessary for describing geometric concepts and occurrences in everyday life. Once a formal definition of a function is provided, students then consider functions of discrete and continuous rates and understand the difference between the two. Students apply their knowledge of linear equations and their graphs from Module 4 to graphs of linear functions. Students inspect the rate of change of linear functions and conclude that the rate of change is the slope of the graph of a line. They learn to interpret the equation y=mx+b as defining a linear function whose graph is a line. Students compare linear functions and their graphs and gain experience with non-linear functions as well. In the second and final topic of this module, students extend what they learned in Grade 7 about how to solve real-world and mathematical problems related to volume from simple solids to include problems that require the formulas for cones, cylinders, and spheres.
Find the rest of the EngageNY Mathematics resources at https://archive.org/details/engageny-mathematics.
This lesson unit is intended to help teachers assess how well students …
This lesson unit is intended to help teachers assess how well students are able to interpret distanceĐtime graphs and, in particular, to help you identify students who: interpret distanceĐtime graphs as if they are pictures of situations rather than abstract representations of them; and have difficulty relating speeds to slopes of these graphs.
This lesson unit is intended to help teahcers assess how well students …
This lesson unit is intended to help teahcers assess how well students are able to interpret speed as the slope of a linear graph and translate between the equation of a line and its graphical representation.
Using the LEGO MINDSTORMS(TM) NXT kit, students construct experiments to measure the …
Using the LEGO MINDSTORMS(TM) NXT kit, students construct experiments to measure the time it takes a free falling body to travel a specified distance. Students use the touch sensor, rotational sensor, and the NXT brick to measure the time of flight for the falling object at different release heights. After the object is released from its holder and travels a specified distance, a touch sensor is triggered and time of object's descent from release to impact at touch sensor is recorded and displayed on the screen of the NXT. Students calculate the average velocity of the falling object from each point of release, and construct a graph of average velocity versus time. They also create a best fit line for the graph using spreadsheet software. Students use the slope of the best fit line to determine their experimental g value and compare this to the standard value of g.
Monitor the temperature of a melting ice cube and use temperature probes …
Monitor the temperature of a melting ice cube and use temperature probes to electronically plot the data on graphs. Investigate what temperature the ice is as it melts in addition to monitoring the temperature of liquid the ice is submerged in.
This lesson unit is intended to help you assess how well students …
This lesson unit is intended to help you assess how well students use algebra in context, and in particular, how well students: explore relationships between variables in everyday situations; find unknown values from known values; find relationships between pairs of unknowns, and express these as tables and graphs; and find general relationships between several variables, and express these in different ways by rearranging formulae.
(Nota: Esta es una traducción de un recurso educativo abierto creado por …
(Nota: Esta es una traducción de un recurso educativo abierto creado por el Departamento de Educación del Estado de Nueva York (NYSED) como parte del proyecto "EngageNY" en 2013. Aunque el recurso real fue traducido por personas, la siguiente descripción se tradujo del inglés original usando Google Translate para ayudar a los usuarios potenciales a decidir si se adapta a sus necesidades y puede contener errores gramaticales o lingüísticos. La descripción original en inglés también se proporciona a continuación.)
En el primer tema de este módulo de 15 días, los estudiantes aprenden el concepto de una función y por qué las funciones son necesarias para describir conceptos geométricos y ocurrencias en la vida cotidiana. Una vez que se proporciona una definición formal de una función, los estudiantes consideran funciones de tarifas discretas y continuas y comprenden la diferencia entre los dos. Los estudiantes aplican su conocimiento de las ecuaciones lineales y sus gráficos del módulo 4 a los gráficos de funciones lineales. Los estudiantes inspeccionan la tasa de cambio de funciones lineales y concluyen que la tasa de cambio es la pendiente de la gráfica de una línea. Aprenden a interpretar la ecuación y = mx+b como definir una función lineal cuyo gráfico es una línea. Los estudiantes comparan funciones lineales y sus gráficos y también obtienen experiencia con funciones no lineales. En el segundo y último tema de este módulo, los estudiantes extienden lo que aprendieron en el grado 7 sobre cómo resolver los problemas del mundo real y las matemáticas relacionadas con el volumen de sólidos simples para incluir problemas que requieren las fórmulas para conos, cilindros y esferas.
Encuentre el resto de los recursos matemáticos de Engageny en https://archive.org/details/engageny-mathematics.
English Description: In the first topic of this 15 day module, students learn the concept of a function and why functions are necessary for describing geometric concepts and occurrences in everyday life. Once a formal definition of a function is provided, students then consider functions of discrete and continuous rates and understand the difference between the two. Students apply their knowledge of linear equations and their graphs from Module 4 to graphs of linear functions. Students inspect the rate of change of linear functions and conclude that the rate of change is the slope of the graph of a line. They learn to interpret the equation y=mx+b as defining a linear function whose graph is a line. Students compare linear functions and their graphs and gain experience with non-linear functions as well. In the second and final topic of this module, students extend what they learned in Grade 7 about how to solve real-world and mathematical problems related to volume from simple solids to include problems that require the formulas for cones, cylinders, and spheres.
Find the rest of the EngageNY Mathematics resources at https://archive.org/details/engageny-mathematics.
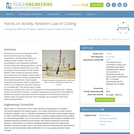
Students come to see the exponential trend demonstrated through the changing temperatures …
Students come to see the exponential trend demonstrated through the changing temperatures measured while heating and cooling a beaker of water. This task is accomplished by first appealing to students' real-life heating and cooling experiences, and by showing an example exponential curve. After reviewing the basic principles of heat transfer, students make predictions about the heating and cooling curves of a beaker of tepid water in different environments. During a simple teacher demonstration/experiment, students gather temperature data while a beaker of tepid water cools in an ice water bath, and while it heats up in a hot water bath. They plot the data to create heating and cooling curves, which are recognized as having exponential trends, verifying Newton's result that the change in a sample's temperature is proportional to the difference between the sample's temperature and the temperature of the environment around it. Students apply and explore how their new knowledge may be applied to real-world engineering applications.
The intent of clarifying statements is to provide additional guidance for educators …
The intent of clarifying statements is to provide additional guidance for educators to communicate the intent of the standard to support the future development of curricular resources and assessments aligned to the 2021 math standards. Clarifying statements can be in the form of succinct sentences or paragraphs that attend to one of four types of clarifications: (1) Student Experiences; (2) Examples; (3) Boundaries; and (4) Connection to Math Practices.
This course will place a emphasis on the continued study of integers, …
This course will place a emphasis on the continued study of integers, order of operations, variables, expressions, equations and polynomials. You will solve equations, write and solve proportions, explore polynomials and build an understanding of important mathematical properties.
No restrictions on your remixing, redistributing, or making derivative works. Give credit to the author, as required.
Your remixing, redistributing, or making derivatives works comes with some restrictions, including how it is shared.
Your redistributing comes with some restrictions. Do not remix or make derivative works.
Most restrictive license type. Prohibits most uses, sharing, and any changes.
Copyrighted materials, available under Fair Use and the TEACH Act for US-based educators, or other custom arrangements. Go to the resource provider to see their individual restrictions.