September is a great time for data collection activities as students are …
September is a great time for data collection activities as students are naturally curious about their new classmates. Ask questions that require students to analyze data and support their conclusions.
Module 7 presents an opportunity for students to practice addition and subtraction …
Module 7 presents an opportunity for students to practice addition and subtraction strategies within 100 and problem-solving skills as they learn to work with various types of units within the contexts of length, money, and data. Students represent categorical and measurement data using picture graphs, bar graphs, and line plots. They revisit measuring and estimating length from Module 2, though now using both metric and customary units.
Find the rest of the EngageNY Mathematics resources at https://archive.org/details/engageny-mathematics.
In this biology lab extension, student will have already collected leaves from …
In this biology lab extension, student will have already collected leaves from the playground and surrounding school areas and sorted them into categories according to leaf properties. Students will use the leave classifications/ sorts to graph the properties of the leaves.
Students visit second- and fourth-grade classes to measure the heights of older …
Students visit second- and fourth-grade classes to measure the heights of older students using large building blocks as a non-standard unit of measure. They also measure adults in the school community. Results are displayed in age-appropriate bar graphs (paper cut-outs of miniature building blocks glued on paper to form bar graphs) enabling a comparison of the heights of different age groups. The activities that comprise this activity help students develop the concepts and vocabulary to describe, in a non-ambiguous way, how heights change as children age. This introduction to graphing provides an important foundation for creating and interpreting graphs in future years.
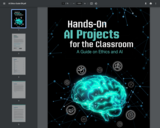
In this guide, students’ exploration of AI is framed within the context …
In this guide, students’ exploration of AI is framed within the context of ethical considerations and aligned with standards and concepts, and depths of understanding that would be appropriate across various subject areas and grade levels in K–12. Depending on the level of your students and the amount of time you have available, you might complete an entire project, pick and choose from the listed activities, or you might take students’ learning further by taking advantage of the additional extensions and resources provided for you. For students with no previous experience with AI education, exposure to the guided learning activities alone will create an understanding of their world that they likely did not previously have. And for those with some background in computer science or AI, the complete projects and resources will still challenge their thinking and expose them to new AI technologies and applications across various fields of study.
Project 1: Fair's Fair Project 2: Who is in Control? Project 3: The Trade-offs of AI Technology Project 4: AI and the 21st Century Worker
Visit the ISTE website with all the free practical guides for engaging students in AI creation: https://www.iste.org/areas-of-focus/AI-in-education.
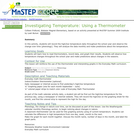
Students will record the temperature daily, using a bar graph, color coded …
Students will record the temperature daily, using a bar graph, color coded bars. this monthly bar graph helps students understand phenology and interpreting graphs.
Students plant sunflower seeds in plastic cups, and once germinated, expose them …
Students plant sunflower seeds in plastic cups, and once germinated, expose them to varying light or soil moisture conditions. They measure growth of the seedlings every few days using non-standard measurement (inch cubes). After a few weeks, they compare the growth of plants exposed to the different conditions and make bar comparative graphs, which they analyze to draw conclusions about the needs of plants.
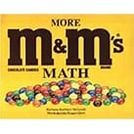
In this lesson, students will use M&M's to construct a graph, read …
In this lesson, students will use M&M's to construct a graph, read a graph, and make comparisons with other students data. The teacher will tie in literature by reading "More M&M's Math" to follow along with the lesson.
(Nota: Esta es una traducción de un recurso educativo abierto creado por …
(Nota: Esta es una traducción de un recurso educativo abierto creado por el Departamento de Educación del Estado de Nueva York (NYSED) como parte del proyecto "EngageNY" en 2013. Aunque el recurso real fue traducido por personas, la siguiente descripción se tradujo del inglés original usando Google Translate para ayudar a los usuarios potenciales a decidir si se adapta a sus necesidades y puede contener errores gramaticales o lingüísticos. La descripción original en inglés también se proporciona a continuación.)
El módulo 7 presenta una oportunidad para que los estudiantes practiquen estrategias de adición y sustracción dentro de 100 y habilidades de resolución de problemas a medida que aprenden a trabajar con varios tipos de unidades dentro de los contextos de longitud, dinero y datos. Los estudiantes representan datos categóricos y de medición utilizando gráficos de imágenes, gráficos de barras y parcelas de línea. Revisan la medición y la longitud de estimación del módulo 2, aunque ahora utilizan unidades métricas y habituales.
Encuentre el resto de los recursos matemáticos de Engageny en https://archive.org/details/engageny-mathematics.
English Description: Module 7 presents an opportunity for students to practice addition and subtraction strategies within 100 and problem-solving skills as they learn to work with various types of units within the contexts of length, money, and data. Students represent categorical and measurement data using picture graphs, bar graphs, and line plots. They revisit measuring and estimating length from Module 2, though now using both metric and customary units.
Find the rest of the EngageNY Mathematics resources at https://archive.org/details/engageny-mathematics.
The intent of clarifying statements is to provide additional guidance for educators …
The intent of clarifying statements is to provide additional guidance for educators to communicate the intent of the standard to support the future development of curricular resources and assessments aligned to the 2021 math standards. Clarifying statements can be in the form of succinct sentences or paragraphs that attend to one of four types of clarifications: (1) Student Experiences; (2) Examples; (3) Boundaries; and (4) Connection to Math Practices.
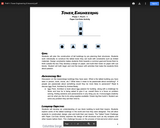
This unit consists of five lessons encouraging younger learners to engineer increasingly …
This unit consists of five lessons encouraging younger learners to engineer increasingly better towers using blocks and recycled materials. Each 30 minute lesson ("phase") includes goals, discussion, activity instructions, extensions, and student worksheets.
Phase 1: Paper Cut-Outs Activity Phase 2: Building Blocks Activity Phase 3: Number of Blocks Activity Phase 4: Building within a Space Activity Phase 5: Recycled Tower Activity
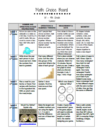
In this lesson, students will investigate how trees change by the season. …
In this lesson, students will investigate how trees change by the season. Includes discussion of techniques for identifying trees, journaling changes that take place over time for the same tree throughout the school year, a list of vocabulary, a field guid to identifying trees, and a tree journal worksheet for students.
NGSS: Partially meets 2-LS4-1
Common Core: W.2.7, W.2.8, 2.MD.D.10
Social Sciences: 3.12, 4.12
Time: 1 hour initially, then 30-40 minute lessons through the seasons
Materials: "The Seasons of Arnold's Apple Tree" book, My Tree Journal pages (included), pencils, colored pencils, and clipboards.
Students will learn the difference between global, prevailing and local winds. In …
Students will learn the difference between global, prevailing and local winds. In this activity, students will make a wind vane out of paper, a straw and a soda bottle and use it to measure wind direction over time. Finally, they will analyze their data to draw conclusions about the prevailing winds in their area.
No restrictions on your remixing, redistributing, or making derivative works. Give credit to the author, as required.
Your remixing, redistributing, or making derivatives works comes with some restrictions, including how it is shared.
Your redistributing comes with some restrictions. Do not remix or make derivative works.
Most restrictive license type. Prohibits most uses, sharing, and any changes.
Copyrighted materials, available under Fair Use and the TEACH Act for US-based educators, or other custom arrangements. Go to the resource provider to see their individual restrictions.