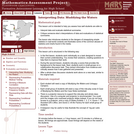
This task addresses many standards regarding the description and analysis of bivariate …
This task addresses many standards regarding the description and analysis of bivariate quantitative data, including regression and correlation. Students should recognize that the pattern shown is one of a strong, positive, linear association, and thus a correlation coefficient value near +1 is plausible. Students should also be able to interpret the slope of the least-squares line as an estimated increase in y per unit change in x (and thus for a 3 unit increase in x, students should expect an estimated increase in y that equals 3 times the model's slope value).
A full AP® Statistics curriculum that explores relevant data in social issues, …
A full AP® Statistics curriculum that explores relevant data in social issues, economics, medicine, sports, and more. The sequence works well in conjunction with the course CED and the most widely-used AP® Statistics textbooks.
In this module, students reconnect with and deepen their understanding of statistics …
In this module, students reconnect with and deepen their understanding of statistics and probability concepts first introduced in Grades 6, 7, and 8. Students develop a set of tools for understanding and interpreting variability in data, and begin to make more informed decisions from data. They work with data distributions of various shapes, centers, and spreads. Students build on their experience with bivariate quantitative data from Grade 8. This module sets the stage for more extensive work with sampling and inference in later grades.
Find the rest of the EngageNY Mathematics resources at https://archive.org/details/engageny-mathematics.
A statistics lesson on describing and making claims from data representations, specifically …
A statistics lesson on describing and making claims from data representations, specifically linearly increasing data. Applies ideas of rate-of-change to develop writing a linear equation to fit the data, using the equation to interpolate and extrapolate additional information, and integrating the mathematical interpretation appropriately into a social sciences argument.
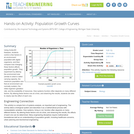
Students analyze the relationship between wheel radius, linear velocity and angular velocity …
Students analyze the relationship between wheel radius, linear velocity and angular velocity by using LEGO(TM) MINDSTORMS(TM) NXT robots. Given various robots with different wheel sizes and fixed motor speeds, they predict which has the fastest linear velocity. Then student teams collect and graph data to analyze the relationships between wheel size and linear velocity and find the angular velocity of the robot given its motor speed. Students explore other ways to increase linear velocity by changing motor speeds, and discuss and evaluate the optimal wheel size and desired linear velocities on vehicles.
Explore how populations change over time in a NetLogo model of sheep …
Explore how populations change over time in a NetLogo model of sheep and grass. Experiment with the initial number of sheep, the sheep birthrate, the amount of energy sheep gain from the grass, and the rate at which the grass re-grows. Remove sheep that have a particular trait (better teeth) from the population, then watch what happens to the sheep teeth trait in the population as a whole. Consider conflicting selection pressures to make predictions about other instances of natural selection.
Learn to connect position-time and velocity-time graphs. Explore velocity using an animated …
Learn to connect position-time and velocity-time graphs. Explore velocity using an animated car icon connected to either a position-time or a velocity-time graph, or both. Then investigate other motion graphs.
This lesson unit is intended to help teachers assess how well students …
This lesson unit is intended to help teachers assess how well students understand the notion of correlation. In particular this unit aims to identify and help students who have difficulty in: understanding correlation as the degree of fit between two variables; making a mathematical model of a situation; testing and improving the model; communicating their reasoning clearly; and evaluating alternative models of the situation.
Following the steps of the iterative engineering design process, student teams use …
Following the steps of the iterative engineering design process, student teams use what they learned in the previous lessons and activity in this unit to research and choose materials for their model heart valves and test those materials to compare their properties to known properties of real heart valve tissues. Once testing is complete, they choose final materials and design and construct prototype valve models, then test them and evaluate their data. Based on their evaluations, students consider how they might redesign their models for improvement and then change some aspect of their models and retest aiming to design optimal heart valve models as solutions to the unit's overarching design challenge. They conclude by presenting for client review, in both verbal and written portfolio/report formats, summaries and descriptions of their final products with supporting data.
As part of the engineering design process to create testable model heart …
As part of the engineering design process to create testable model heart valves, students learn about the forces at play in the human body to open and close aortic valves. They learn about blood flow forces, elasticity, stress, strain, valve structure and tissue properties, and Young's modulus, including laminar and oscillatory flow, stress vs. strain relationship and how to calculate Young's modulus. They complete some practice problems that use the equations learned in the lesson mathematical functions that relate to the functioning of the human heart. With this understanding, students are ready for the associated activity, during which they research and test materials and incorporate the most suitable to design, build and test their own prototype model heart valves.
This lesson unit is intended to help teachers assess how well students …
This lesson unit is intended to help teachers assess how well students are able to: interpret data and evaluate statistical summaries; and critique someone elseŐs interpretations of data and evaluations of statistical summaries. The lesson also introduces students to the dangers of misapplying simple statistics in real-world contexts, and illustrates some of the common abuses of statistics and charts found in the media.
The intent of clarifying statements is to provide additional guidance for educators …
The intent of clarifying statements is to provide additional guidance for educators to communicate the intent of the standard to support the future development of curricular resources and assessments aligned to the 2021 math standards. Clarifying statements can be in the form of succinct sentences or paragraphs that attend to one of four types of clarifications: (1) Student Experiences; (2) Examples; (3) Boundaries; and (4) Connection to Math Practices.
Using Avida-ED freeware, students control a few factors in an environment populated …
Using Avida-ED freeware, students control a few factors in an environment populated with digital organisms, and then compare how changing these factors affects population growth. They experiment by altering the environment size (similar to what is called carrying capacity, the maximum population size that an environment can normally sustain), the initial organism gestation rate, and the availability of resources. How systems function often depends on many different factors. By altering these factors one at a time, and observing the results, students are able to clearly see the effect of each one.
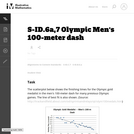
This is a task from the Illustrative Mathematics website that is one …
This is a task from the Illustrative Mathematics website that is one part of a complete illustration of the standard to which it is aligned. Each task has at least one solution and some commentary that addresses important asects of the task and its potential use. Here are the first few lines of the commentary for this task: The scatterplot below shows the finishing times for the Olympic gold medalist in the men's 100-meter dash for many previous Olympic games. The least sq...
No restrictions on your remixing, redistributing, or making derivative works. Give credit to the author, as required.
Your remixing, redistributing, or making derivatives works comes with some restrictions, including how it is shared.
Your redistributing comes with some restrictions. Do not remix or make derivative works.
Most restrictive license type. Prohibits most uses, sharing, and any changes.
Copyrighted materials, available under Fair Use and the TEACH Act for US-based educators, or other custom arrangements. Go to the resource provider to see their individual restrictions.