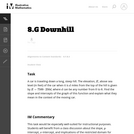
This is a task from the Illustrative Mathematics website that is one …
This is a task from the Illustrative Mathematics website that is one part of a complete illustration of the standard to which it is aligned. Each task has at least one solution and some commentary that addresses important asects of the task and its potential use. Here are the first few lines of the commentary for this task: Joshua's mail truck travels 14 miles every day he works, and is not used at all on days he does not work. At the end of his 100th day of work the mail ...
This task could be put to good use in an instructional sequence …
This task could be put to good use in an instructional sequence designed to develop knowledge related to students' understanding of linear functions in contexts. Though students could work independently on the task, collaboration with peers is more likely to result in the exploration of a range of interpretations.
This task is intended strictly for instructional purposes with the goal of …
This task is intended strictly for instructional purposes with the goal of building understandings of linear relationships within a meaningful and, hopefully, somewhat familiar context.
This task asks students to find a linear function that models something …
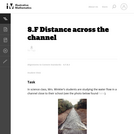
This task asks students to find a linear function that models something in the real world. After finding the equation of the linear relationship between the depth of the water and the distance across the channel, students have to verbalize the meaning of the slope and intercept of the line in the context of this situation.
Students gain a basic understanding of the properties of media soil, sand, …
Students gain a basic understanding of the properties of media soil, sand, compost, gravel and how these materials affect the movement of water (infiltration/percolation) into and below the surface of the ground. They learn about permeability, porosity, particle size, surface area, capillary action, storage capacity and field capacity, and how the characteristics of the materials that compose the media layer ultimately affect the recharging of groundwater tables. They test each type of material, determining storage capacity, field capacity and infiltration rates, seeing the effect of media size on infiltration rate and storage. Then teams apply the testing results to the design their own material mixes that best meet the design requirements. To conclude, they talk about how engineers apply what students learned in the activity about the infiltration rates of different soil materials to the design of stormwater management systems.
This task would be especially well-suited for instructional purposes. Students will benefit …
This task would be especially well-suited for instructional purposes. Students will benefit from a class discussion about the slope, y-intercept, x-intercept, and implications of the restricted domain for interpreting more precisely what the equation is modeling.
Explore the forces at work when you try to push a filing …
Explore the forces at work when you try to push a filing cabinet. Create an applied force and see the resulting friction force and total force acting on the cabinet. Charts show the forces, position, velocity, and acceleration vs. time. View a Free Body Diagram of all the forces (including gravitational and normal forces).
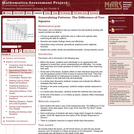
This lesson unit is intended to help you assess how well students …
This lesson unit is intended to help you assess how well students working with square numbers are able to: choose an appropriate, systematic way to collect and organize data, examining the data for patterns; describe and explain findings clearly and effectively; generalize using numerical, geometrical, graphical and/or algebraic structure; and explain why certain results are possible/impossible, moving towards a proof.
In Grades 6 and 7, students worked with data involving a single …
In Grades 6 and 7, students worked with data involving a single variable. Module 6 introduces students to bivariate data. Students are introduced to a function as a rule that assigns exactly one value to each input. In this module, students use their understanding of functions to model the possible relationships of bivariate data. This module is important in setting a foundation for students work in algebra in Grade 9.
Discover how electricity can be converted into other forms of energy such …
Discover how electricity can be converted into other forms of energy such as light and heat. Connect resistors and holiday light bulbs to simple circuits and monitor the temperature over time. Investigate the differences in temperature between the circuit with the resistor and the circuit using the bulb.
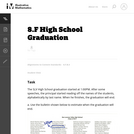
While not a full-blown modeling problem, this task does address some aspects …
While not a full-blown modeling problem, this task does address some aspects of modeling as described in Standard for Mathematical Practice 4. Also, students often think that time must always be the independent variable, and so may need some help understanding that one chooses the independent and dependent variable based on the way one wants to view a situation.
This lesson unit is intended to help teachers assess how well students …
This lesson unit is intended to help teachers assess how well students are able to interpret distanceĐtime graphs and, in particular, to help you identify students who: interpret distanceĐtime graphs as if they are pictures of situations rather than abstract representations of them; and have difficulty relating speeds to slopes of these graphs.
Through multi-trial experiments, students are able to see and measure something that …
Through multi-trial experiments, students are able to see and measure something that is otherwise invisible to them seeing plants breathe. Student groups are given two small plants of native species and materials to enclose them after watering with colored water. After being enclosed for 5, 10 and 15 minutes, teams collect and measure the condensed water from the plants' "breathing," and then calculate the rates at which the plants breathe. A plant's breath is known as transpiration, which is the flow of water from the ground where it is taken up by roots (plant uptake) and then lost through the leaves. Students plot volume/time data for three different native plant species, determine and compare their transpiration rates to see which had the highest reaction rate and consider how a plant's unique characteristics (leaf surface area, transpiration rate) might figure into engineers' designs for neighborhood stormwater management plans.
This lesson unit is intended to help teahcers assess how well students …
This lesson unit is intended to help teahcers assess how well students are able to interpret speed as the slope of a linear graph and translate between the equation of a line and its graphical representation.
Using the LEGO MINDSTORMS(TM) NXT kit, students construct experiments to measure the …
Using the LEGO MINDSTORMS(TM) NXT kit, students construct experiments to measure the time it takes a free falling body to travel a specified distance. Students use the touch sensor, rotational sensor, and the NXT brick to measure the time of flight for the falling object at different release heights. After the object is released from its holder and travels a specified distance, a touch sensor is triggered and time of object's descent from release to impact at touch sensor is recorded and displayed on the screen of the NXT. Students calculate the average velocity of the falling object from each point of release, and construct a graph of average velocity versus time. They also create a best fit line for the graph using spreadsheet software. Students use the slope of the best fit line to determine their experimental g value and compare this to the standard value of g.
This lesson unit is intended to help you assess how well students …
This lesson unit is intended to help you assess how well students use algebra in context, and in particular, how well students: explore relationships between variables in everyday situations; find unknown values from known values; find relationships between pairs of unknowns, and express these as tables and graphs; and find general relationships between several variables, and express these in different ways by rearranging formulae.
No restrictions on your remixing, redistributing, or making derivative works. Give credit to the author, as required.
Your remixing, redistributing, or making derivatives works comes with some restrictions, including how it is shared.
Your redistributing comes with some restrictions. Do not remix or make derivative works.
Most restrictive license type. Prohibits most uses, sharing, and any changes.
Copyrighted materials, available under Fair Use and the TEACH Act for US-based educators, or other custom arrangements. Go to the resource provider to see their individual restrictions.