
- Subject:
- Mathematics
- Material Type:
- Full Course
- Provider:
- Pearson
- Date Added:
- 10/06/2016


Putting Math to Work
Type of Unit: Problem Solving
Prior Knowledge
Students should be able to:
Solve problems with rational numbers using all four operations.
Write ratios and rates.
Use a rate table to solve problems.
Write and solve proportions.
Use multiple representations (e.g., tables, graphs, and equations) to display data.
Identify the variables in a problem situation (i.e., dependent and independent variables).
Write formulas to show the relationship between two variables, and use these formulas to solve for a problem situation.
Draw and interpret graphs that show the relationship between two variables.
Describe graphs that show proportional relationships, and use these graphs to make predictions.
Interpret word problems, and organize information.
Graph in all quadrants of the coordinate plane.
Lesson Flow
As a class, students use problem-solving steps to work through a problem about lightning. In the next lesson, they use the same problem-solving steps to solve a similar problem about lightning. The lightning problems use both rational numbers and rates. Students then choose a topic for a math project. Next, they solve two problems about gummy bears using the problem-solving steps. They then have 3 days of Gallery problems to test their problem-solving skills solo or with a partner. Encourage students to work on at least one problem individually so they can better prepare for a testing situation. The unit ends with project presentations and a short unit test.

Students work in a whole-class setting, independently, and with partners to design and implement a problem-solving plan based on the mathematical concepts of rates and multiple representations (e.g., tables, equations, and graphs). They analyze a rule of thumb and use this relationship to calculate the distance in miles from a viewer's vantage point to lightning.Key ConceptsThroughout this unit, students are encouraged to apply the mathematical concepts they have learned over the course of this year to new settings. Help students develop and refine these problem-solving skills:Creating a problem-solving plan and implementing the plan systematicallyPersevering through challenging problems to find solutionsRecalling prior knowledge and applying that knowledge to new situationsMaking connections between previous learning and real-world problemsCommunicating their approaches with precision and articulating why their strategies and solutions are reasonableCreating efficacy and confidence in solving challenging problems in the real worldGoals and Learning ObjectivesCreate and implement a problem-solving plan.Organize and interpret data presented in a problem situation.Analyze the relationship between two variables.Create a rate table to organize data and make predictions.Apply the relationship between the variables to write a mathematical formula and use the formula to solve problems.Create a graph to display proportional relationships, and use this graph to make predictions.Articulate strategies, thought processes, and approaches to solving a problem, and defend why the solution is reasonable.

During this two-day lesson, students work with a partner to create and implement a problem-solving plan based on the mathematical concepts of rates, ratios, and proportionality. Students analyze the relationship between different-sized gummy bears to solve problems involving size and price.Key ConceptsThroughout this unit, students are encouraged to apply the mathematical concepts they have learned over the course of this year to new settings. Help students develop and refine these problem-solving skills:Creating a problem solving plan and implementing their plan systematicallyPersevering through challenging problems to find solutionsRecalling prior knowledge and applying that knowledge to new situationsMaking connections between previous learning and real-world problemsCommunicating their approaches with precision and articulating why their strategies and solutions are reasonableCreating efficacy and confidence in solving challenging problems in a real worldGoals and Learning ObjectivesCreate and implement a problem-solving plan.Organize and interpret data presented in a problem situation.Analyze the relationship between two variables.Use ratios.Write and solve proportions.Create rate tables to organize data and make predictions.Use multiple representations—including tables, graphs, and equations—to organize and communicate data.Articulate strategies, thought processes, and approaches to solving a problem, and defend why the solution is reasonable.

During this two-day lesson, students work with a partner to create and implement a problem-solving plan based on the mathematical concepts of rates, ratios, and proportionality. Students analyze the relationship between different-sized gummy bears to solve problems involving size and price.Key ConceptsThroughout this unit, students are encouraged to apply the mathematical concepts they have learned over the course of this year to new settings. Helping students develop and refine these problem solving skills:Creating a problem solving plan and implementing their plan systematicallyPersevering through challenging problems to find solutionsRecalling prior knowledge and applying that knowledge to new situationsMaking connections between previous learning and real-world problemsCommunicating their approaches with precision and articulating why their strategies and solutions are reasonableCreating efficacy and confidence in solving challenging problems in a real worldGoals and Learning ObjectivesCreate and implement a problem-solving plan.Organize and interpret data presented in a problem situation.Analyze the relationship between two variables.Use ratios.Write and solve proportions.Create rate tables to organize data and make predictionsUse multiple representations—including tables, graphs, and equations—to organize and communicate data.Articulate strategies, thought processes, and approaches to solving a problem and defend why the solution is reasonable.

Students create and implement a problem-solving plan to solve another problem involving the relationship between the sound of thunder and the distance of the lightning.Key ConceptsThroughout this unit, students are encouraged to apply the mathematical concepts they have learned over the course of this year to new settings. Help students develop and refine these problem-solving skills:Creating a problem-solving plan and implementing their plan systematicallyPersevering through challenging problems to find solutionsRecalling prior knowledge and applying that knowledge to new situationsMaking connections between previous learning and real-world problemsCommunicating their approaches with precision and articulating why their strategies and solutions are reasonableCreating efficacy and confidence in solving challenging problems in a real worldGoals and Learning ObjectivesCreate and implement a problem-solving plan.Organize and interpret data presented in a problem situation.Analyze the relationship between two variables.Create a rate table to organize data and make predictions.Apply the relationship between the variables to write a mathematical formula and use the formula to solve problems.Create a graph to display proportional relationships and use this graph to make predictions.Articulate strategies, thought processes, and approaches to solving a problem and defend why the solution is reasonable.

Rate
Type of Unit: Concept
Prior Knowledge
Students should be able to:
Solve problems involving all four operations with rational numbers.
Understand quantity as a number used with a unit of measurement.
Solve problems involving quantities such as distances, intervals of time, liquid volumes, masses of objects, and money, and with the units of measurement for these quantities.
Understand that a ratio is a comparison of two quantities.
Write ratios for problem situations.
Make and interpret tables, graphs, and diagrams.
Write and solve equations to represent problem situations.
Lesson Flow
In this unit, students will explore the concept of rate in a variety of contexts: beats per minute, unit prices, fuel efficiency of a car, population density, speed, and conversion factors. Students will write and refine their own definition for rate and then use it to recognize rates in different situations. Students will learn that every rate is paired with an inverse rate that is a measure of the same relationship. Students will figure out the logic of how units are used with rates. Then students will represent quantitative relationships involving rates, using tables, graphs, double number lines, and formulas, and they will see how to create one such representation when given another.
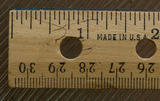
In this lesson, students use a ruler that measures both inches and centimeters to find conversion factors for converting inches to centimeters and centimeters to inches.Key ConceptsRates can be used to convert a measurement in one unit to a corresponding measurement in another unit. We call rates that are used for such purposes conversion factors.The conversion factor 2.54 centimeters per inch is used to convert a measurement in inches to a measurement in centimeters (or, from the English system to the metric system).The conversion factor 0.3937 inches per centimeter is used to convert a measurement in centimeters to a measurement in inches (or, from the metric system to the English system).In the calculation, the inch units cancel out and the remaining centimeter units are the units of the answer, or vice versa.Goals and Learning ObjectivesExplore rate in the context of finding and using conversion factors.Understand that there are two conversion factors that translate a measurement in one unit to a corresponding measurement in another unit, and that these two conversion factors are inverses of one another.

In this lesson, students represent quantitative relationships involving rates using tables, graphs, double number lines, and formulas. Students will understand how to create one such representation when given another representation.Key ConceptsQuantitative relationships involving rates can be represented using tables, graphs, double number lines, and formulas. One such representation can be used to create another representation. Two rates can describe each situation: the rate and its inverse. For the water pump situation, there are two related formulas: a formula for finding the quantity of water pumped for any amount of time, and a formula for finding the amount of time for any quantity of water.Goals and Learning ObjectivesUnderstand that tables, graphs, double number lines, and formulas can be used to represent the same situation.Compare the different representations within a situation and the same representation across similar situations.Understand each representation and how to find the rate in each one.
In this lesson, students use their knowledge of rates, graphs of rates, and formulas to solve problems.Key ConceptsThe formula for a rate is a mathematical way of writing a rule for computing a value. Rate formulas describe a constant relationship between two quantities. Each point on the graph of a rate shows a pair of related values. A graph of a constant rate is a straight line.Goals for Learning ObjectivesUncover any partial understandings and misconceptions students have about rate, graphs of rates, and formulas.Develop a more robust understanding of rate.Help identify which Gallery problems students should work on.

In this lesson, students focus on the units used with rates. Students are given calculations without units and must determine the correct units to use.Key ConceptsWhen dividing quantity A by quantity B to find a rate, the unit of the quotient is expressed in the form A per B.When multiplying a B quantity by an A per B rate, you get an A quantity.Some rates, while mathematically correct, are physically impossible in the real world.Goals and Learning ObjectivesUnderstand the units that result from rate calculations.

In this lesson, students write formulas to represent different rate relationships.Key ConceptsA formula is a mathematical way of writing a rule for computing a value.Formulas, like c = 2.50w or d = 20g, describe the relationship between quantities.The formula c = 2.50w describes the relationship between a cost and a quantity that costs $2.50 per unit of weight. Here, w stands for any weight, and c stands for the cost of w pounds at $2.50 per pound.The formula d = 20g describes the relationship between the distance, d, and the number of gallons of gas, g, for a car that gets 20 miles per gallon.Goals and Learning ObjectivesUse equations with two variables to express relationships between quantities that vary together.

In this lesson, students first watch three racers racing against each other. The race is shown on a track and represented on a graph. Students then change the speed, distance, and time to create a race with different results. They graph the new race and compare their graph to the original race graph.Key ConceptsA rate situation can be represented by a graph. Each point on a graph represents a pair of values. In today's situation, each point represents an amount of time and the distance a racer traveled in that amount of time. Time is usually plotted on the horizontal axis. The farther right a point is from the origin, the more time has passed from the start. Distance is usually plotted on the vertical axis. The higher up a point is from the origin, the farther the snail has traveled from the start. A graph of a constant speed is a straight line. Steeper lines show faster speeds.Goals and Learning ObjectivesUnderstand that a graph can be a visual representation of an actual rate situation.Plot pairs of related values on a graph.Use graphs to develop an understanding of rates.

6th Grade Chapter 5: Geometry - Parent Workbook
![OREGON MATH STANDARDS (2021): [6.AEE]](https://img.oercommons.org/160x134/oercommons/media/courseware/lesson/image/13138_ODE_Math_Logo_2018-H_color_BvjqVNy.png)
The intent of clarifying statements is to provide additional guidance for educators to communicate the intent of the standard to support the future development of curricular resources and assessments aligned to the 2021 math standards. Clarifying statements can be in the form of succinct sentences or paragraphs that attend to one of four types of clarifications: (1) Student Experiences; (2) Examples; (3) Boundaries; and (4) Connection to Math Practices.
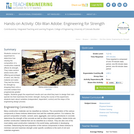
Students conduct an experiment to determine how varying the composition of a construction material affects its strength. They make several adobe bricks with differing percentages of sand, soil, fibrous material and water. They test the bricks for strength by dropping them onto a concrete surface from progressively greater heights. Students graph the experiment results and use what they learn to design their own special mix that maximizes the bricks' strength. During the course of the experiment, students learn about variables (independent, dependent, control) and the steps of the engineering design process.

The earliest explorers did not have computers or satellites to help them know their exact location. The most accurate tool developed was the sextant to determine latitude and longitude. In this activity, the sextant is introduced and discussed with the class. Students will learn how a sextant can be a reliable tool that is still being used by today's navigators and how computers can help assure accuracy when measuring angles. Also, this activity will show how computers can be used to understand equations even when knowing how to do the math is unknown.

Music and sound are two different concepts that share much in common. Determining the difference between the two can sometimes be difficult due to the subjective nature of deciding what is or is not music. The goal of this activity is to take something constructed by students, that would be normally classified as just sound and have the class work together to make what can be perceived to be music. Students construct basic stringed instruments made of shoeboxes and rubber bands. This activity aims to increase student understanding of what distinguishes music from sound.
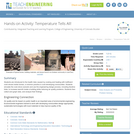
Students are introduced to the health risks caused by cooking and heating with inefficient cook stoves inside homes, a common practice in rural developing communities. Students simulate the cook stove scenario and use the engineering design process, including iterative trials, to increase warmth inside a building while reducing air quality problems. Students then collect and graph data, and analyze their findings.

Investigate the effect of gravity on objects of various mass during free fall. Predict what the position-time and velocity-time graphs will look like. Compare graphs for light and heavy objects.