This ChemMatters article provides a history of the study of ozone, a …
This ChemMatters article provides a history of the study of ozone, a description of an experimental simulation called "The World Avoided," a brief introduction to the chemistry of ozone, an explanation of how ozone is measured, and the difference between "good" ozone in the stratosphere vs "bad" ozone in the troposhere. ChemMatters is an educational magazine published by the American Chemical Society.
Graph reading and data analysis are highlighted in this activity where students …
Graph reading and data analysis are highlighted in this activity where students identify the countries that produce the highest levels of polluting atmospheric emissions. They compare these data with the population of the countries, and describe how the percentage of total emissions and total population numbers are related. The resource includes the graph and a student worksheet. This is an activity from Space Update, a collection of resources and activities provided to teach about Earth and space. Summary background information, data and images supporting the activity are available on the Earth Update data site.
In this activity, students are challenged to predict the next day's weather …
In this activity, students are challenged to predict the next day's weather based on cloud observations, prevailing winds, and barometric measurements over a period of several days. The activity can be done as guided or open-ended inquiry and serves as an authentic assessment to conclude a unit on weather. Resources needed to conduct this activity include weather instruments, some of which can be constructed from household materials. The resource includes background information, a pre-activity inquiry exploration for students, teaching tips and questions to guide student discussion. This is chapter 16 of Meteorology: An Educator's Resource for Inquiry-Based Learning for Grades 5-9. The guide includes a discussion of learning science, the use of inquiry in the classroom, instructions for making simple weather instruments, and more than 20 weather investigations ranging from teacher-centered to guided and open inquiry investigations.
This poster illustrates and describes types of high-, low-, and mid-altitude clouds. …
This poster illustrates and describes types of high-, low-, and mid-altitude clouds. Poster back has article and activity related to Earth's water cycle, as well as a cloud identification quiz and a water cycle crossword puzzle.
In this activity, students investigate the interacting parts of the Earth system …
In this activity, students investigate the interacting parts of the Earth system by observing changes in evaporation rate in four small aquariums with different initial conditions. The demonstration requires 4 small aquariums, soil, plants, water, graduated cylinder, scale, plastic wrap, and colored pencils. A student data sheet is included. The resource is supported by teacher background information, assessment suggestions, and a scoring rubric. This is Activity 3 in the learning module, Global Balance, part of the lesson series, The Potential Consequences of Climate Variability and Change.
In this activity, students build a basic understanding of how a sling …
In this activity, students build a basic understanding of how a sling psychrometer is used to determine relative humidity and learn how to read a chart to determine this relationship. In addition, the student will become familiar with the concept of dew point. Materials need to conduct the investigation include two thermometers, a wooden dowel, wood screw, two washers, a section of plastic straw, and a hollow shoelace. The resource includes background information, teaching tips and questions to guide student discussion. This is chapter 11 of Meteorology: An Educator's Resource for Inquiry-Based Learning for Grades 5-9. The guide includes a discussion of learning science, the use of inquiry in the classroom, instructions for making simple weather instruments, and more than 20 weather investigations ranging from teacher-centered to guided and open inquiry investigations.
This series of ten lessons has been developed to teach students about …
This series of ten lessons has been developed to teach students about local and global water issues. They are based on NASA’s Global Precipitation Measurement (GPM) Mission. The activities are done largely outdoors and include scientific data collection and analysis and integrate technology. Many of the lessons involve data collected based on protocols from the GLOBE Program. Each lesson is designed to take one hour; the lessons build on each other, but can also be used independently. Each lesson topic includes a lesson plan, PowerPoint presentation, student capture sheet and capture sheet answer guide.
This is a model for students to assemble, aimed at enhancing their …
This is a model for students to assemble, aimed at enhancing their knowledge of NASA spacecraft and scientific facts. The cover contains background information about the Thermosphere, Ionosphere, Mesosphere Energetics and Dynamics (TIMED) mission as well as two language arts activities to reinforce space science vocabulary and concepts.
Dancing Lights: Exploring the Aurora through Art and Writing is a science-in-literacy …
Dancing Lights: Exploring the Aurora through Art and Writing is a science-in-literacy program about the aurora. Students in grades 3-5 write and illustrate their perceptions, ideas, and facts pertaining to auroral science. This short educator background primer was based upon interactions with teachers during Dancing Lights workshops and is meant as a quick guide to the science of the aurora.
In this activity, student teams design and conduct a scientific investigation in …
In this activity, student teams design and conduct a scientific investigation in which they explore the conditions necessary for life. They conduct observations of environmental conditions both indoor and outdoor, and determine the range of variation they see. They compare these data with published temperature data for Earth, Mars, Pluto and Venus. The activity supports inquiry into the real world challenge of searching for life in extreme environments. The resource includes several student data sheets, data table and images, and a teacher's guide. Materials needed for this activity include weather instruments (e.g., thermometers, barometers, anemometers). This is Activity A of two activities in the first module, titled "Temperature variations and habitability," of the resource, "Earth Climate Course: What Determines a Planet's Climate?" The course aims to help students to develop an understanding of our environment as a system of human and natural processes that result in changes that occur over various space and time scales.
In this activity, student teams create a knowledge map of the essential …
In this activity, student teams create a knowledge map of the essential characteristics or factors of a planet with a habitable climate, identifying range of inputs, outputs and variables of a planetary environmental system. Identified characteristics are compared to extreme environments on Earth, such as the Antarctic or the Sahara desert, and are used to consider the real life challenge of searching for life in extreme environments. The resource includes a student data sheet, questions, teacher's guide and scoring rubric. This is Activity B of two activities in the first module, titled "Temperature variations and habitability," of the resource, Earth Climate Course: What Determines a Planet's Climate? The course aims to help students to develop an understanding of our environment as a system of human and natural processes that result in changes that occur over various space and time scales.
Students examine graphical and tabular data to determine whether the evidence suggests …
Students examine graphical and tabular data to determine whether the evidence suggests that becomes CO² concentrations and temperature rise can be linked causally. The resource provides graphs and tabular data for student investigation and a student worksheet. This is an activity from Space Update, a collection of resources and activities provided to teach about Earth and space. Summary background information, data and images supporting the activity are available on the Earth Update data site.
Learners will read or listen to a story about two sisters, Marisol …
Learners will read or listen to a story about two sisters, Marisol and Sofia, as they explore the Sun's role in the water cycle. Additionally, numerous extension resources are included in the accompanying educator guide, such as suggestions for no-cost language arts activities, links to further science activities, a book walk cue chart to guide classroom discussion before, during, and after the story, a graphic organizer, and alignments to the National Science Education Standards (NSES) and the Next Generation Science Standards (NGSS).
This chapter provides a series of investigations, ranging from teacher-centered to open …
This chapter provides a series of investigations, ranging from teacher-centered to open inquiry, that involve the formation of clouds in a model cyclone, and demonstrating how the availability of heat (indicated by temperature) affects formation and duration of the cyclone. Instructions for building the experimental apparatus is found in Appendix 6. Additional materials needed include a heat source, beaker, thermometer, and a metal pan. The resource includes background information, teaching tips and questions to guide student discussion. This is chapter 13 of Meteorology: An Educator's Resource for Inquiry-Based Learning for Grades 5-9. The guide includes a discussion of learning science, the use of inquiry in the classroom, instructions for making simple weather instruments, and more than 20 weather investigations ranging from teacher-centered to guided and open inquiry investigations.
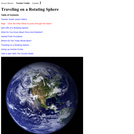
This lesson applies the science and math of the rotation of a …
This lesson applies the science and math of the rotation of a sphere to water and wind movements on Earth. Students are introduced to convection, the Trade Winds and the Coriolis Force. Using an online visualizer, students generate trajectories and then analyze course patterns and latitudinal changes in strength. Note that this is lesson two of five on the Ocean Motion website. Each lesson investigates ocean surface circulation using satellite and model data and can be done independently. See Related URL's for links to the Ocean Motion Website that provide science background information, data resources, teacher material, student guides and a lesson matrix.
In this activity, student teams learn about research design and design a …
In this activity, student teams learn about research design and design a controlled experiment exploring the relationship between a hypothetical planet, an energy source, and distance. They analyze the data and derive an equation to describe the observations. Includes student data sheets, a teacher's guide, and a tutorial on how to use the spreadsheet program Excel. This is Activity A in module 3, titled "Using Mathematic Models to Investigate Planetary Habitability," of the resource, Earth Climate Course: What Determines a Planet's Climate? The course aims to help students to develop an understanding of our environment as a system of human and natural processes that result in changes that occur over various space and time scales.
In this activity, students build a simple computer model to determine the …
In this activity, students build a simple computer model to determine the black body surface temperature of planets in our solar system: Mercury, Venus, Earth, Mars, Jupiter, Saturn, Uranus, Neptune and Pluto. Experiments altering the luminosity and distance to the light source will allow students to determine the energy reaching the object and its black body temperature. The activity builds on student outcomes from activity A, "Finding a Mathematical Description of a Physical Relationship." It also supports inquiry into a real-world problem, the effect of urban heat islands and deforestation on climate. Includes a teacher's guide, student worksheets, and an Excel tutorial. This is Activity B of module 3, titled "Using Mathematic Models to Investigate Planetary Habitability," of the resource, Earth Climate Course: What Determines a Planet's Climate? The course aims to help students to develop an understanding of our environment as a system of human and natural processes that result in changes that occur over various space and time scales.
Students explore how mathematical descriptions of the physical environment can be fine-tuned …
Students explore how mathematical descriptions of the physical environment can be fine-tuned through testing using data. In this activity, student teams obtain satellite data measuring the Earth's albedo, and then input this data into a spreadsheet-based radiation balance model, GEEBITT. They validate their results against published the published albedo value of the Earth, and conduct similar comparisons Mercury, Venus and Mars. The resource includes an Excel spreadsheet tutorial, an investigation, student data sheets and a teacher's guide. Students apply their understanding to the real life problem of urban heat islands and deforestation. The activity links builds on student outcomes from activities A and B: "Finding a Mathematical Description of a Physical Relationship," and "Making a Simple Mathematical Model." This is Activity C in module 3, Using Mathematical Models to Investigate Planetary Habitability, of the resource, Earth Climate Course: What Determines a Planet's Climate? The course aims to help students to develop an understanding of our environment as a system of human and natural processes that result in changes that occur over various space and time scales.
This is a lesson about the vertical dimension of the atmosphere and …
This is a lesson about the vertical dimension of the atmosphere and includes four activities. Activity 1 Introduces concepts related to distance, including length and height and units of measurement. Students are asked to make comparisons of distances. In activity 2, students learn about the vertical profile of the atmosphere. They work with a graph and plot the heights of objects and the layers of the atmosphere: troposphere, stratosphere, mesosphere, thermosphere, and exosphere. In activity 3, students learn about other forms of visual displays using satellite imagery. They compare images of the same weather feature, a hurricane, using two different images from MODIS and CALIPSO. One image is looking down on the hurricane from space, the other looks through the hurricane to display a profile of the hurricane. Activity 4 reinforces the concept of the vertical nature of the atmosphere. Students will take a CALIPSO satellite image that shows a profile of the atmosphere and use this information to plot mountains and clouds on their own graph of the atmosphere. The recommended order for the activities is to complete the first two activities on day one, and the second two activities on day two. Each day will require approximately 1 to 1.5 hours.
Atmospheric scientists use computer models to forecast the position of a moving …
Atmospheric scientists use computer models to forecast the position of a moving volcanic cloud, and remote sensing can identify its components, including gases and aerosols. This resource provides ideas for classroom investigation of these topics, and directions for a demonstration of light scattering by aerosols. The lesson ideas are from PUMAS - Practical Uses of Math and Science - a collection of brief examples created by scientists and engineers showing how math and science topics taught in K-12 classes have real world applications.
No restrictions on your remixing, redistributing, or making derivative works. Give credit to the author, as required.
Your remixing, redistributing, or making derivatives works comes with some restrictions, including how it is shared.
Your redistributing comes with some restrictions. Do not remix or make derivative works.
Most restrictive license type. Prohibits most uses, sharing, and any changes.
Copyrighted materials, available under Fair Use and the TEACH Act for US-based educators, or other custom arrangements. Go to the resource provider to see their individual restrictions.