Intermediate students are asked to analyze data on the components of consumption …
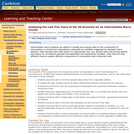
Intermediate students are asked to analyze data on the components of consumption and investment expenditures and explanatory variables based on textbook models of each. Students look for rough correlations between the explanatory and dependent variables.
Students learn how engineers gather data and model motion using vectors. They …
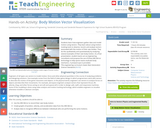
Students learn how engineers gather data and model motion using vectors. They learn about using motion-tracking tools to observe, record, and analyze vectors associated with the motion of their own bodies. They do this qualitatively and quantitatively by analyzing several examples of their own body motion. As a final presentation, student teams act as engineering consultants and propose the use of (free) ARK Mirror technology to help sports teams evaluate body mechanics. A pre/post quiz is provided.
This example focuses on six letters to the editor. All six letters …
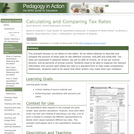
This example focuses on six letters to the editor. All six letters attempt to describe and compare the amount of taxes paid on two different incomes: $30,000 and $200,000. Tax rates are expressed in absolute dollars, tax per $1,000 of income, $1 of tax per income amount, and as percents of annual income. Students need to be able to organize the relevant information and convert each stated tax rate to a standard form to help make comparisons. Additionally, students need to be aware that letter writers may make their own mistakes!
As a class, students use a low-cost air quality monitor (a rentable …
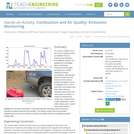
As a class, students use a low-cost air quality monitor (a rentable “Pod”) to measure the emissions from different vehicles. By applying the knowledge about combustion chemistry that they gain during the pre-activity reading (or lecture presentation, alternatively), students predict how the emissions from various vehicles will differ in terms of pollutants (CO2, VOCs and NO2), and explain why. After data collection, students examine the time series plots as a class—a chance to interpret the results and compare them to their predictions. Short online videos and a current event article help to highlight the real-world necessity of understanding and improving vehicle emissions. Numerous student handouts are provided. The activity content may be presented independently of its unit and without using an air quality monitor by analyzing provided sample data.
In this assignment, a group of four to five students will select …
In this assignment, a group of four to five students will select one country that has been ranked in the World Development Indicators of the World Bank, the Human Development Indicators of the United Nations Development Program, and the Happy Planet Indicator of the New Economic Foundation. Using the selected country's political, social, and economic statistics, each group will assess the methodology and validity of the measurements of WDI, HDI, and HPI indicators for the country. Students will compare and contrast the measurement methods, analyze the strengths and weaknesses of each indicator, and propose recommendations to improve these indicators.
In this individual research project, a senior thesis student conducts a regression …
In this individual research project, a senior thesis student conducts a regression analysis that investigates the effects of race, ethnicity, and poverty on high school graduation rates in Florida. The data are easily obtainable from the Florida Department of Education. The project can be modified to be a group research project in a Research Methods Class or a Special Topics Upper Level Economics class.
In this undergraduate research and service learning project, students and faculty collaborate …
In this undergraduate research and service learning project, students and faculty collaborate on a study of the effects of condemned/restored homes in their college town on surrounding property values. While this example describes an experience in a small, upper-level elective course, it includes suggestions for modifications of design and learning goals for other learning levels and environments.
Ice core data allow students to explore a number of patterns while …
Ice core data allow students to explore a number of patterns while learning that researchers need to gather and interpret evidence to understand Earth's past. Students will explore core data collected in Western Greenland that document a few decades of Earth's atmosphere. Students are challenged to identify patterns and then use those patterns and background information to answer a few key questions. The data include measurements of temperature, dust, and atmospheric gases. Downloadable files are provided for those who intend to run the activity in person. For those running the activity with an online or virtual class, a separate page includes all of the necessary information for students to complete the activity, including an interactive graph and background readings. Support videos are provided.
This activity provides an excellent example of an active debate within the …
This activity provides an excellent example of an active debate within the scientific community regarding a relatively recent human fossil find, Homo floresiensis. The activity highlights the ways in which scientists can interpret scientific evidence in different ways, how scientists build arguments to support their claims, and how assumptions can influence interpretation. Students watch part of a NOVA program on the fossil find, and take notes on the evidence discussed. They then discuss in small groups and then as a large group which argument they consider more convincing and why.
Perhaps the first skill needed for successful quantitative reasoning is the ability …
Perhaps the first skill needed for successful quantitative reasoning is the ability to understand a single number. Newspaper headlines over the last year have used some amazingly large figures when discussing the national debt, bailout funds, corporate bonuses, or economic stimulus packages. Millions, billions, and trillions of dollars are often encountered in such stories. The ability to process these large values and compare their relative values is essential in understanding the financial nuances to such articles. This example contains two in-depth approaches to understanding large quantities.
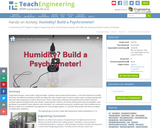
Using thermometers, cotton balls, string and water, students make simple psychrometers—a tool …
Using thermometers, cotton balls, string and water, students make simple psychrometers—a tool that measures humidity. They learn the difference between relative humidity (the ratio of water vapor content to water vapor carrying capacity) and dew point (the temperature at which dew forms). Teams collect data using their homemade psychrometers and then calculate relative humidity inside and outside, comparing their results to an off-the-shelf psychrometer (if available). A lab worksheet is provided for data collection and calculation. As a real-world connection, students learn that humidity and air density is taken into consideration by engineers for many design projects. To conclude, they answer and discuss analysis and application questions.
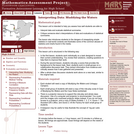
This model-eliciting activity (MEA) challenges students to develop a model for predicting …
This model-eliciting activity (MEA) challenges students to develop a model for predicting the characteristics of a person who has committed a crime. Students work with real data on shoe length, height, and gender to develop the model. Students write a report to the crime victim that identifies a suspect and justifies their decision. The activity sets the stage for students to learn about regression models, and reinforces their understanding of central tendency and variability. It is suggested that this activity be used prior to a formal introduction to linear relationships.
This lesson unit is intended to help teachers assess how well students …
This lesson unit is intended to help teachers assess how well students are able to: interpret data and evaluate statistical summaries; and critique someone elseŐs interpretations of data and evaluations of statistical summaries. The lesson also introduces students to the dangers of misapplying simple statistics in real-world contexts, and illustrates some of the common abuses of statistics and charts found in the media.
Students learn about video motion capture technology, becoming familiar with concepts such …
Students learn about video motion capture technology, becoming familiar with concepts such as vector components, magnitudes and directions, position, velocity, and acceleration. They use a (free) classroom data collection and processing tool—the ARK Mirror—to visualize and record 3-D motion. The Augmented Reality Kinematics (ARK) Mirror software collects data via a motion detector. Using an Orbbec Astra Pro 3D camera or Microsoft Kinect (see note below), students can visualize and record a robust set of data and interpret them using statistical and graphical methods. This lesson introduces students to just one possible application of the ARK Mirror software—in the context of a high school physics class. Note: The ARK Mirror is ported to operate on an Orbbec platform. It may also be used with a Microsoft Kinect, although that Microsoft hardware has been discontinued. Refer to the Using ARK Mirror and Microsoft Kinect attachment for how to use the ARK MIrror software with Microsoft Kinect.
This model-eliciting activity (MEA) challenges students to develop ideas about center and …
This model-eliciting activity (MEA) challenges students to develop ideas about center and variability when making decisions based on data. Students examine data on departure delays for five airlines flying out of the Chicago O'Hare airport. The task is to develop a model to determine which airline has the best chance of departing on time. Students write a report that identifies the best airline and the reasoning behind their decision.
At the beginning of a DNA, DNA replication, and mitosis unit, students …
At the beginning of a DNA, DNA replication, and mitosis unit, students are given a short science news article summarizing a recent research paper. This assignment links the article to figures and key techniques from a related journal article, requiring students to apply and transfer the knowledge they gained in the unit.
Spreadsheets Across the Curriculum/Geology of National Parks module. Students work with a …
Spreadsheets Across the Curriculum/Geology of National Parks module. Students work with a color-coded conditional-formatted spreadsheet map to work through a USGS report applying a coastal vulnerability index, examining real data related to relative sea-level change for different areas of the Californian coas,t including Point Reyes National Seashore.
This model-eliciting activity challenges students to operationally define a construct (study effectiveness). …
This model-eliciting activity challenges students to operationally define a construct (study effectiveness). Students are given a survey to review that rates different aspects of study behaviors. They are then given a set of data for a few students and asked to use their scores to determine an index of study effectiveness. After determining a method, they are then asked to use this index to put five students in rank order according to their scores on study effectiveness. Students write a report explaining the method they used to determine these scores and how they produced their ratings.
After a car and pedestrian accident occurs near the local school, concerned …
After a car and pedestrian accident occurs near the local school, concerned students, parents, and neighbors launch a neighborhood safety project. Students consider potential hazards and then collect traffic and pedestrian data that might shed light on the situation. A survey is conducted to determine how children in the neighborhood travel between home and school, and students challenge their classmates to increase their use of human-powered (foot and pedal) transportation. Students use spreadsheets to enter and represent data, analyze their observations and survey data to determine the most significant problems, and study possible solutions. They develop a proposal for improving traffic safety, create slideshows and brochures, and present their ideas to the local city council.
This unit plan was originally developed by the Intel® Teach program as an exemplary unit plan demonstrating some of the best attributes of teaching with technology.
No restrictions on your remixing, redistributing, or making derivative works. Give credit to the author, as required.
Your remixing, redistributing, or making derivatives works comes with some restrictions, including how it is shared.
Your redistributing comes with some restrictions. Do not remix or make derivative works.
Most restrictive license type. Prohibits most uses, sharing, and any changes.
Copyrighted materials, available under Fair Use and the TEACH Act for US-based educators, or other custom arrangements. Go to the resource provider to see their individual restrictions.