Updating search results...

Search Resources

45 Results

View
Selected filters:
Global Climate Dashboard: Climate Variability
Read the Fine Print
Educational Use
Rating
0.0 stars

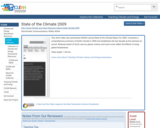
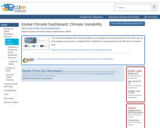
This interactive displays how climate variables are changing over time (temperature, CO2, Arctic sea ice, sun's energy, sea level, etc.) in graphical form. Students can easily examine over 50+ years of archived data.

Subject:
Career and Technical Education
Environmental Studies
Physical Science
Material Type:
Reading
Simulation
Provider:
CLEAN: Climate Literacy and Energy Awareness Network
Provider Set:
CLEAN: Climate Literacy and Energy Awareness Network
Author:
NOAA
National Oceanic and Atmospheric Administration
Date Added:
08/29/2012
Hot, Cold, Fresh and Salty
Read the Fine Print
Rating
0.0 stars

The NOAA Ocean Service Education lab requires students create and manipulate solutions simulating different ocean water characteristics in order to recognize that the effects of salinity and temperature are the drivers of thermohaline circulation.

Subject:
Atmospheric Science
Career and Technical Education
Environmental Studies
Oceanography
Physical Science
Material Type:
Activity/Lab
Provider:
CLEAN: Climate Literacy and Energy Awareness Network
Provider Set:
CLEAN: Climate Literacy and Energy Awareness Network
Author:
Jerry Roth
NOAA Ocean Service
Date Added:
09/24/2018
The Incredible Carbon Journey
Read the Fine Print
Rating
0.0 stars

In this activity, students explore the way that human activities have changed the way that carbon is distributed in Earth's atmosphere, lithosphere, biosphere and hydrosphere.

Subject:
Applied Science
Career and Technical Education
Environmental Science
Environmental Studies
Physical Science
Material Type:
Activity/Lab
Provider:
CLEAN: Climate Literacy and Energy Awareness Network
Provider Set:
CLEAN: Climate Literacy and Energy Awareness Network
Author:
NOAA (adapted from Kentucky Association for Environmental Education)
Oceanservice.noaa.gov
Date Added:
09/24/2018
Investigating Coral Bleaching Using Real Data
Read the Fine Print
Rating
0.0 stars

This sequence of activities using real-world data to explain the importance of coral reefs and the relationship of coral reef health to the surrounding environment. Unit includes five activities.

Subject:
Applied Science
Biology
Career and Technical Education
Environmental Science
Environmental Studies
Life Science
Physical Science
Material Type:
Activity/Lab
Provider:
CLEAN: Climate Literacy and Energy Awareness Network
Provider Set:
CLEAN: Climate Literacy and Energy Awareness Network
Author:
Carolyn Joyce
NOAA Ocean Data Education (NODE) Project
Viola Todd
Date Added:
08/17/2018
Investigating El Nino using real data
Read the Fine Print
Rating
0.0 stars

This is a sequence of 5 classroom activities focusing on the El NiÃo climate variability. The activities increase in complexity and student-directedness. The focus of the activities is on accessing and manipulating real data to help students understand El NiÃo as an interaction of Earth systems.

Subject:
Applied Science
Atmospheric Science
Career and Technical Education
Environmental Science
Environmental Studies
Oceanography
Physical Science
Material Type:
Activity/Lab
Provider:
CLEAN: Climate Literacy and Energy Awareness Network
Provider Set:
CLEAN: Climate Literacy and Energy Awareness Network
Author:
Atziri Ibanez
Kate Thompson
Kenneth Casey
NOAA Ocean Data Education (NODE) Project
Date Added:
08/17/2018
Katrina Graphics Archive
Unrestricted Use
Public Domain
Rating
0.0 stars

This page from the National Hurricane Center hosts a variety of still graphics that can be looped into animations of the storm's progress. Images include 3- and 5-day Watches and Warnings, Wind Swaths and Strike Probabilities.

Subject:
Astronomy
Atmospheric Science
Chemistry
Geoscience
Physical Science
Physics
Material Type:
Data Set
Diagram/Illustration
Interactive
Provider:
Science Education Resource Center (SERC) at Carleton College
Provider Set:
Teach the Earth
Author:
NOAA
National Hurricane Center
Date Added:
11/07/2014
Keeping Watch on Coral Reefs
Read the Fine Print
Rating
0.0 stars

This activity identifies and explains the benefits of and threats to coral reef systems. Students read tutorials, describe the role of satellites, analyze oceanographic data and identify actions that can be undertaken to reduce or eliminate threats to coral reefs. As a culminating activity, students prepare a public education program.

Subject:
Geoscience
Physical Science
Material Type:
Activity/Lab
Provider:
CLEAN: Climate Literacy and Energy Awareness Network
Provider Set:
CLEAN: Climate Literacy and Energy Awareness Network
Author:
NOAA Ocean Service Education
Date Added:
10/27/2014
The Methane Circus
Read the Fine Print
Rating
0.0 stars

In this activity from NOAA's Okeanos Explorer Education Materials Collection, learners investigate how methane hydrates might have been involved with the Cambrian explosion.

Subject:
Applied Science
Biology
Career and Technical Education
Ecology
Environmental Science
Environmental Studies
Life Science
Physical Science
Material Type:
Activity/Lab
Provider:
CLEAN: Climate Literacy and Energy Awareness Network
Provider Set:
CLEAN: Climate Literacy and Energy Awareness Network
Author:
NOAA Ocean Explorer
Date Added:
08/17/2018
NOAA Sea Level Trends
Unrestricted Use
CC BY
Rating
0.0 stars

The NOAA Sea Level Trends map illustrates U.S. regional and some international trends in sea level, with arrows representing the direction and magnitude of change. Students can investigate sea level changes around the U.S. and some worldwide using an interactive map interface with supporting data plots and tables.

Subject:
Applied Science
Career and Technical Education
Environmental Science
Environmental Studies
Oceanography
Physical Science
Material Type:
Simulation
Provider:
CLEAN: Climate Literacy and Energy Awareness Network
Provider Set:
CLEAN: Climate Literacy and Energy Awareness Network
Author:
Center for Operational Oceanographic Products and Services, NOAA
Date Added:
06/19/2012
NOAA View Data Exploration Tool
Read the Fine Print
Rating
0.0 stars

This data viewing tool from NOAA offers nearly instant access to dozens of datasets about Earth through an engaging interface. Users can select data categories from atmosphere, ocean, land, cryosphere, and climate and drill down from there into more detailed categories.

Subject:
Career and Technical Education
Environmental Studies
Physical Science
Material Type:
Simulation
Provider:
CLEAN: Climate Literacy and Energy Awareness Network
Provider Set:
CLEAN: Climate Literacy and Energy Awareness Network
Author:
NOAA - National Oceanic and Atmospheric Administration
Date Added:
08/17/2018
Ocean Acidification: The Other Carbon Dioxide Problem
Read the Fine Print
Educational Use
Rating
0.0 stars

This NOAA video discusses how the ocean absorbs the increased amount of carbon dioxide released into the atmosphere, thereby changing the pH and buffering action of the ocean. These changes in pH are impacting calcifying organisms, such as corals and shellfish, and related food chains and ecosystems.

Subject:
Applied Science
Career and Technical Education
Ecology
Environmental Science
Environmental Studies
Life Science
Physical Science
Material Type:
Diagram/Illustration
Reading
Provider:
CLEAN: Climate Literacy and Energy Awareness Network
Provider Set:
CLEAN: Climate Literacy and Energy Awareness Network
Author:
NOAA
National Oceanic and Atmospheric Administration
Date Added:
10/19/2011
Oceans of Energy
Unrestricted Use
CC BY
Rating
0.0 stars

This lesson focuses on the importance of ocean exploration as a way to learn how to capture, control, and distribute renewable ocean energy resources. Students begin by identifying ways the ocean can generate energy and then research one ocean energy source using the Internet. Finally, students build a Micro-Hydro Electric Generator.

Subject:
Career and Technical Education
Environmental Studies
Physical Science
Material Type:
Activity/Lab
Provider:
CLEAN: Climate Literacy and Energy Awareness Network
Provider Set:
CLEAN: Climate Literacy and Energy Awareness Network
Author:
NOAA Ocean Explorer
Date Added:
06/19/2012
Off Base - Acidity of oceans
Read the Fine Print
Rating
0.0 stars

This lesson guides a student inquiry into properties of the ocean's carbonate buffer system, and how changes in atmospheric carbon dioxide levels may affect ocean pH and biological organisms that depend on calcification.

Subject:
Applied Science
Biology
Career and Technical Education
Ecology
Environmental Science
Environmental Studies
Geoscience
Life Science
Physical Science
Technology
Material Type:
Activity/Lab
Provider:
CLEAN: Climate Literacy and Energy Awareness Network
Provider Set:
CLEAN: Climate Literacy and Energy Awareness Network
Author:
NOAA Ocean Explorer
Date Added:
10/27/2014
Sea Level Rise Viewer
Read the Fine Print
Rating
0.0 stars

This web mapping tool allows users to investigate impacts of sea level rise. Data is included from across the United States at different scales. Various timelines and sea level rise projections can be explored.

Subject:
Applied Science
Career and Technical Education
Environmental Science
Environmental Studies
Oceanography
Physical Science
Material Type:
Simulation
Provider:
CLEAN: Climate Literacy and Energy Awareness Network
Provider Set:
CLEAN: Climate Literacy and Energy Awareness Network
Author:
NOAA
NOAA Office for Coastal Management
Date Added:
08/17/2018
Sea-Level Rise Visualization for Alabama, Mississippi, and Florida
Read the Fine Print
Rating
0.0 stars

This is an interactive map that illustrates the scale of potential flooding in Alabama, Mississippi, and Florida due to projected sea level rise. It is a collaborative project of NOAA Sea Grant Consortium and the US Geological Survey. It is a pilot project, so there is some possibility that the resource may not be maintained over time.

Subject:
Applied Science
Career and Technical Education
Environmental Science
Environmental Studies
Oceanography
Physical Science
Material Type:
Simulation
Provider:
CLEAN: Climate Literacy and Energy Awareness Network
Provider Set:
CLEAN: Climate Literacy and Energy Awareness Network
Author:
Mississippi-Alabama Sea Grant Consortium
NOAA Coastal Services Center
U.S. Geological Survey
USGS
Date Added:
09/24/2018
State of the Climate 2009
Read the Fine Print
Rating
0.0 stars

This short video clip summarizes NOAA's annual State of the Climate Report for 2009. It presents a comprehensive summary of Earth's climate in 2009 and establishes the last decade as the warmest on record. Reduced extent of Arctic sea ice, glacier volume, and snow cover reflect the effects of rising global temperature.

Subject:
Atmospheric Science
Physical Science
Provider:
CLEAN: Climate Literacy and Energy Awareness Network
Provider Set:
CLEAN: Climate Literacy and Energy Awareness Network
Author:
NOAA
StormCenter Communications
Date Added:
10/27/2014
Stressed Out!
Unrestricted Use
CC BY
Rating
0.0 stars

In this activity, students research various topics about ocean health, e.g. overfishing, habitat destruction, invasive species, climate change, pollution, and ocean acidification. An optional extension activity has them creating an aquatic biosphere in a bottle experiment in which they can manipulate variables.

Subject:
Applied Science
Biology
Career and Technical Education
Ecology
Environmental Science
Environmental Studies
Life Science
Oceanography
Physical Science
Material Type:
Activity/Lab
Provider:
CLEAN: Climate Literacy and Energy Awareness Network
Provider Set:
CLEAN: Climate Literacy and Energy Awareness Network
Author:
Mel Goodwin
National Oceanic and Atmospheric Administration (NOAA)- Ocean Explorer
Date Added:
06/19/2012
Ten Signs of a Warming World
Read the Fine Print
Rating
0.0 stars

This is an interactive website that provides descriptive information and data related to ten key climate indicators. These climate indicators and related resources show global patterns and data that are intuitive and compelling teaching tools.

Subject:
Applied Science
Atmospheric Science
Career and Technical Education
Environmental Science
Environmental Studies
Geoscience
Oceanography
Physical Science
Material Type:
Simulation
Provider:
CLEAN: Climate Literacy and Energy Awareness Network
Provider Set:
CLEAN: Climate Literacy and Energy Awareness Network
Author:
(NOAA)
National Oceanic and Atmospheric Administration
Date Added:
10/27/2014
Time History of Atmospheric CO2
Read the Fine Print
Educational Use
Rating
0.0 stars

This animated visualization represents a time history of atmospheric carbon dioxide in parts per million (ppm) from 1979 to 2016, and then back in time to 800,000 years before the present.

Subject:
Applied Science
Career and Technical Education
Environmental Science
Environmental Studies
Physical Science
Material Type:
Reading
Simulation
Provider:
CLEAN: Climate Literacy and Energy Awareness Network
Provider Set:
CLEAN: Climate Literacy and Energy Awareness Network
Author:
Carbon Tracker Program
NOAA Earth System Research Laboratory
Date Added:
05/15/2012
To Boldly Go...
Unrestricted Use
CC BY
Rating
0.0 stars

This web-based activity tackles the broad reasons for undertaking ocean exploration - studying the interconnected issues of climate change, ocean health, energy and human health. Students examine the types of technology ocean scientists use to collect important data.

Subject:
Applied Science
Career and Technical Education
Ecology
Environmental Science
Environmental Studies
Life Science
Physical Science
Material Type:
Activity/Lab
Provider:
CLEAN: Climate Literacy and Energy Awareness Network
Provider Set:
CLEAN: Climate Literacy and Energy Awareness Network
Author:
Mel Goodwin
National Oceanic and Atmospheric Administration (NOAA)
Date Added:
06/19/2012