Data Carpentry lesson to learn how to use command-line tools to perform …
Data Carpentry lesson to learn how to use command-line tools to perform quality control, align reads to a reference genome, and identify and visualize between-sample variation. A lot of genomics analysis is done using command-line tools for three reasons: 1) you will often be working with a large number of files, and working through the command-line rather than through a graphical user interface (GUI) allows you to automate repetitive tasks, 2) you will often need more compute power than is available on your personal computer, and connecting to and interacting with remote computers requires a command-line interface, and 3) you will often need to customize your analyses, and command-line tools often enable more customization than the corresponding GUI tools (if in fact a GUI tool even exists). In a previous lesson, you learned how to use the bash shell to interact with your computer through a command line interface. In this lesson, you will be applying this new knowledge to carry out a common genomics workflow - identifying variants among sequencing samples taken from multiple individuals within a population. We will be starting with a set of sequenced reads (.fastq files), performing some quality control steps, aligning those reads to a reference genome, and ending by identifying and visualizing variations among these samples. As you progress through this lesson, keep in mind that, even if you aren’t going to be doing this same workflow in your research, you will be learning some very important lessons about using command-line bioinformatic tools. What you learn here will enable you to use a variety of bioinformatic tools with confidence and greatly enhance your research efficiency and productivity.
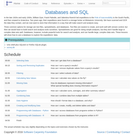
Software Carpentry lesson that teaches how to use databases and SQL In …
Software Carpentry lesson that teaches how to use databases and SQL In the late 1920s and early 1930s, William Dyer, Frank Pabodie, and Valentina Roerich led expeditions to the Pole of Inaccessibility in the South Pacific, and then onward to Antarctica. Two years ago, their expeditions were found in a storage locker at Miskatonic University. We have scanned and OCR the data they contain, and we now want to store that information in a way that will make search and analysis easy. Three common options for storage are text files, spreadsheets, and databases. Text files are easiest to create, and work well with version control, but then we would have to build search and analysis tools ourselves. Spreadsheets are good for doing simple analyses, but they don’t handle large or complex data sets well. Databases, however, include powerful tools for search and analysis, and can handle large, complex data sets. These lessons will show how to use a database to explore the expeditions’ data.
Limiting the debilitating consequences of ageing is a major medical challenge of …
Limiting the debilitating consequences of ageing is a major medical challenge of our time. Robust pharmacological interventions that promote healthy ageing across diverse genetic backgrounds may engage conserved longevity pathways. Here we report results from the Caenorhabditis Intervention Testing Program in assessing longevity variation across 22 Caenorhabditis strains spanning 3 species, using multiple replicates collected across three independent laboratories. Reproducibility between test sites is high, whereas individual trial reproducibility is relatively low. Of ten pro-longevity chemicals tested, six significantly extend lifespan in at least one strain. Three reported dietary restriction mimetics are mainly effective across C. elegans strains, indicating species and strain-specific responses. In contrast, the amyloid dye ThioflavinT is both potent and robust across the strains. Our results highlight promising pharmacological leads and demonstrate the importance of assessing lifespans of discrete cohorts across repeat studies to capture biological variation in the search for reproducible ageing interventions.
Data Carpentry lesson to learn to navigate your file system, create, copy, …
Data Carpentry lesson to learn to navigate your file system, create, copy, move, and remove files and directories, and automate repetitive tasks using scripts and wildcards with genomics data. Command line interface (OS shell) and graphic user interface (GUI) are different ways of interacting with a computer’s operating system. The shell is a program that presents a command line interface which allows you to control your computer using commands entered with a keyboard instead of controlling graphical user interfaces (GUIs) with a mouse/keyboard combination. There are quite a few reasons to start learning about the shell: For most bioinformatics tools, you have to use the shell. There is no graphical interface. If you want to work in metagenomics or genomics you’re going to need to use the shell. The shell gives you power. The command line gives you the power to do your work more efficiently and more quickly. When you need to do things tens to hundreds of times, knowing how to use the shell is transformative. To use remote computers or cloud computing, you need to use the shell.
Edited by Sarah Hare, Jessica Kirschner, and Michelle Reed Short Description: This …
Edited by Sarah Hare, Jessica Kirschner, and Michelle Reed
Short Description: This collaboratively authored guide helps institutions navigate the uncharted waters of tagging course material as open educational resources (OER) or under a low-cost threshold by summarizing relevant state legislation, providing tips for working with stakeholders, and analyzing technological and process considerations. The first half of the book provides high-level analysis of the technology, legislation, and cultural change needed to operationalize course markings. The second half features case studies by Alexis Clifton, Rebel Cummings-Sauls, Michael Daly, Juville Dario-Becker, Tony DeFranco, Cindy Domaika, Ann Fiddler, Andrea Gillaspy Steinhilper, Rajiv Jhangiani, Brian Lindshield, Andrew McKinney, Nathan Smith, and Heather White.
Word Count: 81533
ISBN: 978-1-64816-983-0
(Note: This resource's metadata has been created automatically by reformatting and/or combining the information that the author initially provided as part of a bulk import process.)
This lesson in part of Software Carpentry workshop and teach novice programmers …
This lesson in part of Software Carpentry workshop and teach novice programmers to write modular code and best practices for using R for data analysis. an introduction to R for non-programmers using gapminder data The goal of this lesson is to teach novice programmers to write modular code and best practices for using R for data analysis. R is commonly used in many scientific disciplines for statistical analysis and its array of third-party packages. We find that many scientists who come to Software Carpentry workshops use R and want to learn more. The emphasis of these materials is to give attendees a strong foundation in the fundamentals of R, and to teach best practices for scientific computing: breaking down analyses into modular units, task automation, and encapsulation. Note that this workshop will focus on teaching the fundamentals of the programming language R, and will not teach statistical analysis. The lesson contains more material than can be taught in a day. The instructor notes page has some suggested lesson plans suitable for a one or half day workshop. A variety of third party packages are used throughout this workshop. These are not necessarily the best, nor are they comprehensive, but they are packages we find useful, and have been chosen primarily for their usability.
No restrictions on your remixing, redistributing, or making derivative works. Give credit to the author, as required.
Your remixing, redistributing, or making derivatives works comes with some restrictions, including how it is shared.
Your redistributing comes with some restrictions. Do not remix or make derivative works.
Most restrictive license type. Prohibits most uses, sharing, and any changes.
Copyrighted materials, available under Fair Use and the TEACH Act for US-based educators, or other custom arrangements. Go to the resource provider to see their individual restrictions.