Spreadsheets Across the Curriculum/Geology of National Parks module. Students calculate the haze …
Spreadsheets Across the Curriculum/Geology of National Parks module. Students calculate the haze index and standard visual range from concentrations of particulate matter.
(Note: this resource was added to OER Commons as part of a batch upload of over 2,200 records. If you notice an issue with the quality of the metadata, please let us know by using the 'report' button and we will flag it for consideration.)
A demonstration (with full class participation) to illustrate radioactive decay by flipping …
A demonstration (with full class participation) to illustrate radioactive decay by flipping coins. Shows students visually the concepts of exponential decay, half-life and randomness. Works best in large classes -- the more people, the better.
(Note: this resource was added to OER Commons as part of a batch upload of over 2,200 records. If you notice an issue with the quality of the metadata, please let us know by using the 'report' button and we will flag it for consideration.)
This module addresses the problem of how to determine the density of …
This module addresses the problem of how to determine the density of the earth and has students do some field experiments to get the data they need to answer the problem.
(Note: this resource was added to OER Commons as part of a batch upload of over 2,200 records. If you notice an issue with the quality of the metadata, please let us know by using the 'report' button and we will flag it for consideration.)
This module addresses the problem of how to determine the size of …
This module addresses the problem of how to determine the size of a ton of rocks of a given composition and invites the student to figure out how to solve the problem.
(Note: this resource was added to OER Commons as part of a batch upload of over 2,200 records. If you notice an issue with the quality of the metadata, please let us know by using the 'report' button and we will flag it for consideration.)
This module addresses the real problem of determining the density of the …
This module addresses the real problem of determining the density of the Earth and invites the student to figure out how to solve the problem.
(Note: this resource was added to OER Commons as part of a batch upload of over 2,200 records. If you notice an issue with the quality of the metadata, please let us know by using the 'report' button and we will flag it for consideration.)
Research-grade Global Positioning Systems (GPS) allow students to deduce that Earth's crust …
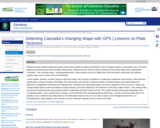
Research-grade Global Positioning Systems (GPS) allow students to deduce that Earth's crust is changing shape in measurable ways. From data gathered by EarthScope's Plate Boundary Observatory, students discover that the Pacific Northwest of the United States and coastal British Columbia -- the Cascadia region - are geologically active: tectonic plates move and collide; they shift and buckle; continental crust deforms; regions warp; rocks crumple, bend, and will break.
(Note: this resource was added to OER Commons as part of a batch upload of over 2,200 records. If you notice an issue with the quality of the metadata, please let us know by using the 'report' button and we will flag it for consideration.)
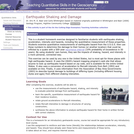
A homework/classroom activity where students collect historical earthquake information and use it …
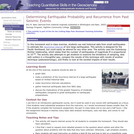
A homework/classroom activity where students collect historical earthquake information and use it to forecast the probability of larger earthquakes.
(Note: this resource was added to OER Commons as part of a batch upload of over 2,200 records. If you notice an issue with the quality of the metadata, please let us know by using the 'report' button and we will flag it for consideration.)
This activity is divided into two parts - 1) Using data from …
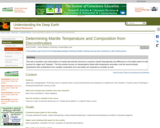
This activity is divided into two parts - 1) Using data from primary literature to calculate mantle potential temperature beneath a ridge and an oceanic island ("hotspot"). 2) Using the transition zone thickness observed beneath a "hotspot" (Hawaii) to analyze contributions from anomalous temperature and composition. In addition to the student activity sheets, an Excel key, instructor notes, and student handouts are included below.
(Note: this resource was added to OER Commons as part of a batch upload of over 2,200 records. If you notice an issue with the quality of the metadata, please let us know by using the 'report' button and we will flag it for consideration.)
In this quantitative field activity, students collect field data on channel geometry, …
In this quantitative field activity, students collect field data on channel geometry, flow velocity, and bed materials. Using these data, they apply flow resistance equations and sediment transport relations to estimate the bankfull discharge and to determine if the flow is sufficient to mobilize the bed.
(Note: this resource was added to OER Commons as part of a batch upload of over 2,200 records. If you notice an issue with the quality of the metadata, please let us know by using the 'report' button and we will flag it for consideration.)
In this assignment, a group of four to five students will select …
In this assignment, a group of four to five students will select one country that has been ranked in the World Development Indicators of the World Bank, the Human Development Indicators of the United Nations Development Program, and the Happy Planet Indicator of the New Economic Foundation. Using the selected country's political, social, and economic statistics, each group will assess the methodology and validity of the measurements of WDI, HDI, and HPI indicators for the country. Students will compare and contrast the measurement methods, analyze the strengths and weaknesses of each indicator, and propose recommendations to improve these indicators.
An analogy of the Earth's history to a cross-country drive. (Note: this …
An analogy of the Earth's history to a cross-country drive.
(Note: this resource was added to OER Commons as part of a batch upload of over 2,200 records. If you notice an issue with the quality of the metadata, please let us know by using the 'report' button and we will flag it for consideration.)
Spreadsheets Across the Curriculum module. Students build spreadsheets to tabulate and graph …
Spreadsheets Across the Curriculum module. Students build spreadsheets to tabulate and graph seismic wave amplitude and energy release to explore the logarithmic scale of earthquake magnitude.
(Note: this resource was added to OER Commons as part of a batch upload of over 2,200 records. If you notice an issue with the quality of the metadata, please let us know by using the 'report' button and we will flag it for consideration.)
This student homework and problem set has students quantitatively earthquake hazard, shaking …
This student homework and problem set has students quantitatively earthquake hazard, shaking and damage.
(Note: this resource was added to OER Commons as part of a batch upload of over 2,200 records. If you notice an issue with the quality of the metadata, please let us know by using the 'report' button and we will flag it for consideration.)
In this module, students are asked to devise a way of graphically …
In this module, students are asked to devise a way of graphically plotting the density variations with depth in the Earth.
(Note: this resource was added to OER Commons as part of a batch upload of over 2,200 records. If you notice an issue with the quality of the metadata, please let us know by using the 'report' button and we will flag it for consideration.)
This module explores the combination of densities and shell thicknesses that produce …
This module explores the combination of densities and shell thicknesses that produce an aggregate density of the Earth of 5.5 g/cm3.
(Note: this resource was added to OER Commons as part of a batch upload of over 2,200 records. If you notice an issue with the quality of the metadata, please let us know by using the 'report' button and we will flag it for consideration.)
I use an "engaging question" on the first day of class in …
I use an "engaging question" on the first day of class in all of my courses. This activity is designed to be both engaging and central to all of the course content. That is, the activity is designed around questions that we can keep coming back to, over and over, after each learning unit. This approach not only provides a unifying focus for the course, but it also provides an opportunity to model critical thinking as we revisit the question each time with a different perspective. For the Dynamic Earth and Global Change (the Physical Geology course at Macalester) I chose a question about climate change. The activity starts with two graphs (plots of surface temperature and atmosphere CO2 composition for the past 1,000 years). Students are asked to describe the graphs, interpret the graphs, make some predictions, and explain the graphs using basic earth science processes.
(Note: this resource was added to OER Commons as part of a batch upload of over 2,200 records. If you notice an issue with the quality of the metadata, please let us know by using the 'report' button and we will flag it for consideration.)
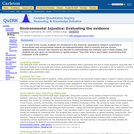
This assignment teaches students how to evaluate arguments concerning the maldistribution of …
This assignment teaches students how to evaluate arguments concerning the maldistribution of environmental hazards, based on complex quantitative data.
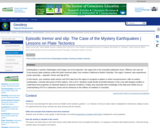
Earthquakes in western Washington and Oregon are to be expected -- the …
Earthquakes in western Washington and Oregon are to be expected -- the region lies in the Cascadia Subduction Zone. Offshore, the Juan de Fuca tectonic plate subducts under the North American plate, from northern California to British Columbia. The region, however, also experiences exotic seismicity -- Episodic Tremor and Slip (ETS).In this lesson, your students study seismic and GPS data from the region to recognize a pattern in which unusual tremors--with no surface earthquakes--coincide with jumps of GPS stations. This is ETS. Students model ductile and brittle behavior of the crust with lasagna noodles to understand how properties of materials depend on physical conditions. Finally, they assemble their knowledge of the data and models into an understanding of ETS in subduction zones and its relevance to the millions of residents in Cascadia.
(Note: this resource was added to OER Commons as part of a batch upload of over 2,200 records. If you notice an issue with the quality of the metadata, please let us know by using the 'report' button and we will flag it for consideration.)
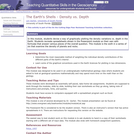
On July 4th, 1997, Mars Pathfinder landed at the mouth of Ares …
On July 4th, 1997, Mars Pathfinder landed at the mouth of Ares Vallis, a large channel that drains into the Chryse Planitia basin. While there remains a great deal to debate about the origin of the channels, one of the leading hypotheses at present is the idea that these features are the result of catastrophic flooding. If this is correct, then the plains where Pathfinder landed may be rich in debris eroded out of the Martian highlands across which the Ares Vallis channel passes, providing a golden combination -- a relatively safe landing site which still provides access to a wide variety of different rock types. [If you would like to learn more about the many Pathfinder results, explore the April, 1999 and January, 2000 issues of the journal Journal of Geophysical Research -- Planets (the green one) in the library.]
For the sake of this lab assignment you will hypothesize that the Ares Vallis and associated deposits were indeed produced by catastrophic flooding, and will use the information at your disposal to learn all you can about the putative flooding event.
(Note: this resource was added to OER Commons as part of a batch upload of over 2,200 records. If you notice an issue with the quality of the metadata, please let us know by using the 'report' button and we will flag it for consideration.)
Simple budgets may be used to estimate the exchange of water in …
Simple budgets may be used to estimate the exchange of water in embayments that capitalize on the concept of steady state and conservation principals. This is especially true for bays that experience a significant exchange of freshwater. This exchange of freshwater may reduce the average salt concentration in the bay compared to seawater if it involves addition of freshwater from rivers, R, and/or precipitation, P. Alternatively, it may increase the average salt concentration in the bay compared to seawater if there is relatively little river input and high evaporation, E. Since freshwater input changes the salt concentration in the bay, and salt is a conservative material, it is possible to combine two steady state budgets for a bay, one for salt and one for water, to solve for the magnitude of the water flows that enter and exit the bay mouth. Students will make actual calculations for the inflow and outflow of water to Puget Sound, Washington and the Mediterranean Sea and compare them to actual measured values.
(Note: this resource was added to OER Commons as part of a batch upload of over 2,200 records. If you notice an issue with the quality of the metadata, please let us know by using the 'report' button and we will flag it for consideration.)
No restrictions on your remixing, redistributing, or making derivative works. Give credit to the author, as required.
Your remixing, redistributing, or making derivatives works comes with some restrictions, including how it is shared.
Your redistributing comes with some restrictions. Do not remix or make derivative works.
Most restrictive license type. Prohibits most uses, sharing, and any changes.
Copyrighted materials, available under Fair Use and the TEACH Act for US-based educators, or other custom arrangements. Go to the resource provider to see their individual restrictions.