As part of a design challenge, students learn how to use a …
As part of a design challenge, students learn how to use a rotation sensor (located inside the casing of a LEGO® MINDSTORMS ® NXT motor) to measure how far a robot moves with each rotation. Through experimentation and measurement with the sensor, student pairs determine the relationship between the number of rotations of the robot's wheels and the distance traveled by the robot. Then they use this ratio to program LEGO robots to move precise distances in a contest of accuracy. The robot that gets closest to the goal without touching the toy figures at the finish line is the winning programming design. Students learn how rotational sensors measure distance, how mathematics can be used for real-world purposes, and about potential sources of error due to gearing when using rotation sensor readings for distance calculations. They also become familiar with the engineering design process as they engage in its steps, from understanding the problem to multiple test/improve iterations to successful design.
Putting Math to Work Type of Unit: Problem Solving Prior Knowledge Students …
Putting Math to Work
Type of Unit: Problem Solving
Prior Knowledge
Students should be able to:
Solve problems with rational numbers using all four operations. Write ratios and rates. Use a rate table to solve problems. Write and solve proportions. Use multiple representations (e.g., tables, graphs, and equations) to display data. Identify the variables in a problem situation (i.e., dependent and independent variables). Write formulas to show the relationship between two variables, and use these formulas to solve for a problem situation. Draw and interpret graphs that show the relationship between two variables. Describe graphs that show proportional relationships, and use these graphs to make predictions. Interpret word problems, and organize information. Graph in all quadrants of the coordinate plane.
Lesson Flow
As a class, students use problem-solving steps to work through a problem about lightning. In the next lesson, they use the same problem-solving steps to solve a similar problem about lightning. The lightning problems use both rational numbers and rates. Students then choose a topic for a math project. Next, they solve two problems about gummy bears using the problem-solving steps. They then have 3 days of Gallery problems to test their problem-solving skills solo or with a partner. Encourage students to work on at least one problem individually so they can better prepare for a testing situation. The unit ends with project presentations and a short unit test.
Students work in a whole-class setting, independently, and with partners to design …
Students work in a whole-class setting, independently, and with partners to design and implement a problem-solving plan based on the mathematical concepts of rates and multiple representations (e.g., tables, equations, and graphs). They analyze a rule of thumb and use this relationship to calculate the distance in miles from a viewer's vantage point to lightning.Key ConceptsThroughout this unit, students are encouraged to apply the mathematical concepts they have learned over the course of this year to new settings. Help students develop and refine these problem-solving skills:Creating a problem-solving plan and implementing the plan systematicallyPersevering through challenging problems to find solutionsRecalling prior knowledge and applying that knowledge to new situationsMaking connections between previous learning and real-world problemsCommunicating their approaches with precision and articulating why their strategies and solutions are reasonableCreating efficacy and confidence in solving challenging problems in the real worldGoals and Learning ObjectivesCreate and implement a problem-solving plan.Organize and interpret data presented in a problem situation.Analyze the relationship between two variables.Create a rate table to organize data and make predictions.Apply the relationship between the variables to write a mathematical formula and use the formula to solve problems.Create a graph to display proportional relationships, and use this graph to make predictions.Articulate strategies, thought processes, and approaches to solving a problem, and defend why the solution is reasonable.
During this two-day lesson, students work with a partner to create and …
During this two-day lesson, students work with a partner to create and implement a problem-solving plan based on the mathematical concepts of rates, ratios, and proportionality. Students analyze the relationship between different-sized gummy bears to solve problems involving size and price.Key ConceptsThroughout this unit, students are encouraged to apply the mathematical concepts they have learned over the course of this year to new settings. Help students develop and refine these problem-solving skills:Creating a problem solving plan and implementing their plan systematicallyPersevering through challenging problems to find solutionsRecalling prior knowledge and applying that knowledge to new situationsMaking connections between previous learning and real-world problemsCommunicating their approaches with precision and articulating why their strategies and solutions are reasonableCreating efficacy and confidence in solving challenging problems in a real worldGoals and Learning ObjectivesCreate and implement a problem-solving plan.Organize and interpret data presented in a problem situation.Analyze the relationship between two variables.Use ratios.Write and solve proportions.Create rate tables to organize data and make predictions.Use multiple representations—including tables, graphs, and equations—to organize and communicate data.Articulate strategies, thought processes, and approaches to solving a problem, and defend why the solution is reasonable.
During this two-day lesson, students work with a partner to create and …
During this two-day lesson, students work with a partner to create and implement a problem-solving plan based on the mathematical concepts of rates, ratios, and proportionality. Students analyze the relationship between different-sized gummy bears to solve problems involving size and price.Key ConceptsThroughout this unit, students are encouraged to apply the mathematical concepts they have learned over the course of this year to new settings. Helping students develop and refine these problem solving skills:Creating a problem solving plan and implementing their plan systematicallyPersevering through challenging problems to find solutionsRecalling prior knowledge and applying that knowledge to new situationsMaking connections between previous learning and real-world problemsCommunicating their approaches with precision and articulating why their strategies and solutions are reasonableCreating efficacy and confidence in solving challenging problems in a real worldGoals and Learning ObjectivesCreate and implement a problem-solving plan.Organize and interpret data presented in a problem situation.Analyze the relationship between two variables.Use ratios.Write and solve proportions.Create rate tables to organize data and make predictionsUse multiple representations—including tables, graphs, and equations—to organize and communicate data.Articulate strategies, thought processes, and approaches to solving a problem and defend why the solution is reasonable.
Students create and implement a problem-solving plan to solve another problem involving …
Students create and implement a problem-solving plan to solve another problem involving the relationship between the sound of thunder and the distance of the lightning.Key ConceptsThroughout this unit, students are encouraged to apply the mathematical concepts they have learned over the course of this year to new settings. Help students develop and refine these problem-solving skills:Creating a problem-solving plan and implementing their plan systematicallyPersevering through challenging problems to find solutionsRecalling prior knowledge and applying that knowledge to new situationsMaking connections between previous learning and real-world problemsCommunicating their approaches with precision and articulating why their strategies and solutions are reasonableCreating efficacy and confidence in solving challenging problems in a real worldGoals and Learning ObjectivesCreate and implement a problem-solving plan.Organize and interpret data presented in a problem situation.Analyze the relationship between two variables.Create a rate table to organize data and make predictions.Apply the relationship between the variables to write a mathematical formula and use the formula to solve problems.Create a graph to display proportional relationships and use this graph to make predictions.Articulate strategies, thought processes, and approaches to solving a problem and defend why the solution is reasonable.
In this lesson, students are introduced to rate in the context of …
In this lesson, students are introduced to rate in the context of music. They will explore beats per minute and compare rates using mathematical representations including graphs and double number lines.Key ConceptsBeats per minute is a rate. Musicians often count the number of beats per measure to determine the tempo of a song. A fast tempo produces music that seems to be racing, whereas a slow tempo results in music that is more relaxing. When graphed, sets with more beats per minute have smaller intervals on the double number line and steeper lines on the graph.Goals and Learning ObjectivesInvestigate rate in music.Find beats per minute by counting beats in music.Represent beats per minute on a double number line and a graph.
In this lesson, students explore rate in the context of grocery shopping. …
In this lesson, students explore rate in the context of grocery shopping. Students use the unit price, or price per egg, to find the price of any number of eggs.Key ConceptsA unit price is a rate. The unit price tells the price of one unit of something (for example, one pound of cheese, one quart of milk, one box of paper clips, one package of cereal, and so on).The unit price can be found by dividing the price in dollars by the number of units.The unit price can be used to find the price of any quantity of something by multiplying the unit price by the quantity.Goals and Learning ObjectivesInvestigate rate as a unit price.Find a unit price by dividing the price in dollars by the number of units.Find the price of any quantity of something by multiplying that quantity by the unit price.
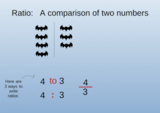
In this lesson, students use an interactive map to compare the crowdedness …
In this lesson, students use an interactive map to compare the crowdedness of three countries of their choice. They learn that to compare countries with different areas and populations, they need to calculate population density—a rate that compares the population of a region to its area.Key ConceptsA ratio is a comparison of two quantities by division. It can be expressed in the forms a to b, a:b, or ab, where b ≠ 0. The value of a ratio is found by dividing the two quantities. A ratio provides a relative comparison of two quantities. A rate is a ratio that compares two quantities measured in different units. Population density is a rate that compares the population of a region to its area. The value is given in number of people per unit of area.ELL: Identifying key words are crucial for students. Spend some time discussing the key vocabulary in this unit.Goals and Learning ObjectivesExplore rate in the context of population density.Compare three countries to see which is most crowded—that is, which has the greatest population density.
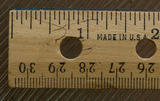
In this lesson, students use a ruler that measures both inches and …
In this lesson, students use a ruler that measures both inches and centimeters to find conversion factors for converting inches to centimeters and centimeters to inches.Key ConceptsRates can be used to convert a measurement in one unit to a corresponding measurement in another unit. We call rates that are used for such purposes conversion factors.The conversion factor 2.54 centimeters per inch is used to convert a measurement in inches to a measurement in centimeters (or, from the English system to the metric system).The conversion factor 0.3937 inches per centimeter is used to convert a measurement in centimeters to a measurement in inches (or, from the metric system to the English system).In the calculation, the inch units cancel out and the remaining centimeter units are the units of the answer, or vice versa.Goals and Learning ObjectivesExplore rate in the context of finding and using conversion factors.Understand that there are two conversion factors that translate a measurement in one unit to a corresponding measurement in another unit, and that these two conversion factors are inverses of one another.
In this lesson, students write formulas to represent different rate relationships.Key ConceptsA …
In this lesson, students write formulas to represent different rate relationships.Key ConceptsA formula is a mathematical way of writing a rule for computing a value.Formulas, like c = 2.50w or d = 20g, describe the relationship between quantities.The formula c = 2.50w describes the relationship between a cost and a quantity that costs $2.50 per unit of weight. Here, w stands for any weight, and c stands for the cost of w pounds at $2.50 per pound.The formula d = 20g describes the relationship between the distance, d, and the number of gallons of gas, g, for a car that gets 20 miles per gallon.Goals and Learning ObjectivesUse equations with two variables to express relationships between quantities that vary together.
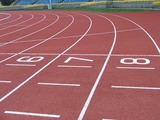
In this lesson, students first watch three racers racing against each other. …
In this lesson, students first watch three racers racing against each other. The race is shown on a track and represented on a graph. Students then change the speed, distance, and time to create a race with different results. They graph the new race and compare their graph to the original race graph.Key ConceptsA rate situation can be represented by a graph. Each point on a graph represents a pair of values. In today's situation, each point represents an amount of time and the distance a racer traveled in that amount of time. Time is usually plotted on the horizontal axis. The farther right a point is from the origin, the more time has passed from the start. Distance is usually plotted on the vertical axis. The higher up a point is from the origin, the farther the snail has traveled from the start. A graph of a constant speed is a straight line. Steeper lines show faster speeds.Goals and Learning ObjectivesUnderstand that a graph can be a visual representation of an actual rate situation.Plot pairs of related values on a graph.Use graphs to develop an understanding of rates.
In this lesson, students watch a video of a runner and express …
In this lesson, students watch a video of a runner and express his speed as a rate in meters per second. Students then use the rate to determine how long it takes the runner to go any distance.Key ConceptsSpeed is a rate that is expressed as distance traveled per unit of time. Miles per hour, laps per minute, and meters per second are all examples of units for speed. The measures of speed, distance, and time are all related. The relationship can be expressed in three ways: d = rt, r = dt, t = dr.Goals and Learning ObjectivesExplore speed as a rate that measures the relationship between two aspects of a situation: distance and time.In comparing distance, speed, and time, understand how to use any two of these measures to find the third measure.
Students use their knowledge of rates to solve problems.Key ConceptsGiven any two …
Students use their knowledge of rates to solve problems.Key ConceptsGiven any two values in a rate situation, you can find the third value.These three equations are equivalent, and they all describe rate relationships:y = rx, r = yx, x = yrAt the beginning of this lesson (or for homework), students will revise their work on the pre-assessment Self Check. Their revised work will provide data that you and your students can use to reassess students' understanding of rate. You can use this information to clear up any remaining misconceptions and to help students integrate their learning from the past several days into a deeper and more coherent whole.The work students do in this lesson and in revising their pre-assessments will help you and your students decide how to help them during the Gallery. In this lesson, students will reveal the depth and clarity of their understanding of rate.Students whose understanding of rate is still delicate should get extra help during the Gallery.Students who feel that they have a robust understanding of rate may choose from any of the problem-solving or deeper mathematics problems in the Gallery.Goals and Learning ObjectivesUncover any partial understandings and misconceptions about rate.Develop a more robust understanding of rate.Identify which Gallery problems to work on.
Students watch a video in which two students discuss the problem of …
Students watch a video in which two students discuss the problem of how to compare fuel efficiency. Students then analyze the work of the two students as they use rates to determine fuel efficiency in two different ways.Key ConceptsFuel efficiency is a rate. Fuel efficiency can be expressed in miles per gallon (mpg). This rate is useful for determining how far a vehicle can travel using any number of gallons of gas. Fuel efficiency can also be expressed in gallons per mile (gpm). This rate is useful for determining how many gallons of gas a vehicle uses to travel any number of miles.The rates miles per gallon and gallons per mile are inverse rates—they both describe the same relationship. For example, the rates 20 miles per gallon and 0.05 gallon per mile both describe the relationship between 300 miles and 15 gallons. The greater the rate in miles per gallon, the better the fuel efficiency. The smaller the rate in gallons per mile, the better the fuel efficiency.SWD: Some students with disabilities will benefit from a preview of the goals in each lesson. This will help to highlight for students the critical features and/or concepts and will help them to pay close attention to salient information.Goals and Learning ObjectivesExplore rate in the context of fuel efficiency.Express fuel efficiency as the rate miles per gallon (mpg) and as its inverse, gallons per mile (gpm).Use the rate miles per gallon to find the number of miles a car can travel on a number of gallons of gas.Use the rate gallons per mile to find the number of gallons of gas used for a number of miles driven.
This lesson unit is intended to help sixth grade teachers assess how …
This lesson unit is intended to help sixth grade teachers assess how well students are able to: Analyze a realistic situation mathematically; construct sight lines to decide which areas of a room are visible or hidden from a camera; find and compare areas of triangles and quadrilaterals; and calculate and compare percentages and/or fractions of areas.
Students design and build their own model levees. Acting as engineers for …
Students design and build their own model levees. Acting as engineers for their city, teams create sturdy barriers to prevent water from flooding a city in the event of a hurricane.
No restrictions on your remixing, redistributing, or making derivative works. Give credit to the author, as required.
Your remixing, redistributing, or making derivatives works comes with some restrictions, including how it is shared.
Your redistributing comes with some restrictions. Do not remix or make derivative works.
Most restrictive license type. Prohibits most uses, sharing, and any changes.
Copyrighted materials, available under Fair Use and the TEACH Act for US-based educators, or other custom arrangements. Go to the resource provider to see their individual restrictions.