This task addresses many standards regarding the description and analysis of bivariate …
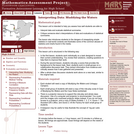
This task addresses many standards regarding the description and analysis of bivariate quantitative data, including regression and correlation. Students should recognize that the pattern shown is one of a strong, positive, linear association, and thus a correlation coefficient value near +1 is plausible. Students should also be able to interpret the slope of the least-squares line as an estimated increase in y per unit change in x (and thus for a 3 unit increase in x, students should expect an estimated increase in y that equals 3 times the model's slope value).
A full AP® Statistics curriculum that explores relevant data in social issues, …
A full AP® Statistics curriculum that explores relevant data in social issues, economics, medicine, sports, and more. The sequence works well in conjunction with the course CED and the most widely-used AP® Statistics textbooks.
Students work as physicists to understand centripetal acceleration concepts. They also learn …
Students work as physicists to understand centripetal acceleration concepts. They also learn about a good robot design and the accelerometer sensor. They also learn about the relationship between centripetal acceleration and centripetal force governed by the radius between the motor and accelerometer and the amount of mass at the end of the robot's arm. Students graph and analyze data collected from an accelerometer, and learn to design robots with proper weight distribution across the robot for their robotic arms. Upon using a data logging program, they view their own data collected during the activity. By activity end , students understand how a change in radius or mass can affect the data obtained from the accelerometer through the plots generated from the data logging program. More specifically, students learn about the accuracy and precision of the accelerometer measurements from numerous trials.
In this module, students reconnect with and deepen their understanding of statistics …
In this module, students reconnect with and deepen their understanding of statistics and probability concepts first introduced in Grades 6, 7, and 8. Students develop a set of tools for understanding and interpreting variability in data, and begin to make more informed decisions from data. They work with data distributions of various shapes, centers, and spreads. Students build on their experience with bivariate quantitative data from Grade 8. This module sets the stage for more extensive work with sampling and inference in later grades.
Find the rest of the EngageNY Mathematics resources at https://archive.org/details/engageny-mathematics.
Students analyze the relationship between wheel radius, linear velocity and angular velocity …
Students analyze the relationship between wheel radius, linear velocity and angular velocity by using LEGO(TM) MINDSTORMS(TM) NXT robots. Given various robots with different wheel sizes and fixed motor speeds, they predict which has the fastest linear velocity. Then student teams collect and graph data to analyze the relationships between wheel size and linear velocity and find the angular velocity of the robot given its motor speed. Students explore other ways to increase linear velocity by changing motor speeds, and discuss and evaluate the optimal wheel size and desired linear velocities on vehicles.
This lab demonstrates Ohm's law as students set up simple circuits each …
This lab demonstrates Ohm's law as students set up simple circuits each composed of a battery, lamp and resistor. Students calculate the current flowing through the circuits they create by solving linear equations. After solving for the current, I, for each set resistance value, students plot the three points on a Cartesian plane and note the line that is formed. They also see the direct correlation between the amount of current flowing through the lamp and its brightness.
With your mouse, drag data points and their error bars, and watch …
With your mouse, drag data points and their error bars, and watch the best-fit polynomial curve update instantly. You choose the type of fit: linear, quadratic, cubic, or quartic. The reduced chi-square statistic shows you when the fit is good. Or you can try to find the best fit by manually adjusting fit parameters.
This lesson unit is intended to help teachers assess how well students …
This lesson unit is intended to help teachers assess how well students understand the notion of correlation. In particular this unit aims to identify and help students who have difficulty in: understanding correlation as the degree of fit between two variables; making a mathematical model of a situation; testing and improving the model; communicating their reasoning clearly; and evaluating alternative models of the situation.
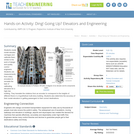
Students create model elevator carriages and calibrate them, similar to the work …
Students create model elevator carriages and calibrate them, similar to the work of design and quality control engineers. Students use measurements from rotary encoders to recreate the task of calibrating elevators for a high-rise building. They translate the rotations from an encoder to correspond to the heights of different floors in a hypothetical multi-story building. Students also determine the accuracy of their model elevators in getting passengers to their correct destinations.
This activity poses the question: What would happen if a meteor or …
This activity poses the question: What would happen if a meteor or comet impacted Earth? Students simulate an impact in a container of sand using various-sized rocks, all while measuring, recording and graphing results and conclusions. Then students brainstorm ways to prevent an object from hitting the Earth.
This activity utilizes hands-on learning with the conservation of energy and the …
This activity utilizes hands-on learning with the conservation of energy and the interaction of friction. Students use a roller coaster track and collect position data. The students then calculate velocity, and energy data. After the lab, students relate the conversion of potential and kinetic energy to the conversion of energy used in a hybrid car.
Students learn how to use and graph real-world stream gage data to …
Students learn how to use and graph real-world stream gage data to create event and annual hydrographs and calculate flood frequency statistics. Using an Excel spreadsheet of real-world event, annual and peak streamflow data, they manipulate the data (converting units, sorting, ranking, plotting), solve problems using equations, and calculate return periods and probabilities. Prompted by worksheet questions, they analyze the runoff data as engineers would. Students learn how hydrographs help engineers make decisions and recommendations to community stakeholders concerning water resources and flooding.
Students are introduced to different ways of displaying visual spectra, including colored …
Students are introduced to different ways of displaying visual spectra, including colored "barcode" spectra, like those produced by a diffraction grating, and line plots displaying intensity versus color, or wavelength. Students learn that a diffraction grating acts like a prism, bending light into its component colors.
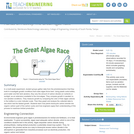
In a multi-week experiment, student groups gather data from the photobioreactors that …
In a multi-week experiment, student groups gather data from the photobioreactors that they build to investigate growth conditions that make algae thrive best. Using plastic soda bottles, pond water and fish tank aerators, they vary the amount of carbon dioxide (or nutrients or sunlight, as an extension) available to the microalgae. They compare growth in aerated vs. non-aerated conditions. They measure growth by comparing the color of their algae cultures in the bottles to a color indicator scale. Then they graph and analyze the collected data to see which had the fastest growth. Students learn how plants biorecycle carbon dioxide into organic carbon (part of the carbon cycle) and how engineers apply their understanding of this process to maximize biofuel production.
Students learn about weight and drag forces by making paper helicopters and …
Students learn about weight and drag forces by making paper helicopters and measuring how adding more weight affects the time it takes for the helicopters to fall to the ground.
This lesson unit is intended to help teachers assess how well students …
This lesson unit is intended to help teachers assess how well students are able to: interpret data and evaluate statistical summaries; and critique someone elseŐs interpretations of data and evaluations of statistical summaries. The lesson also introduces students to the dangers of misapplying simple statistics in real-world contexts, and illustrates some of the common abuses of statistics and charts found in the media.
While building and testing model rockets fueled by antacid tablets, students are …
While building and testing model rockets fueled by antacid tablets, students are introduced to the basic physics concepts on how rockets work. Students revise and improve their initial designs. Note: This activity is similar to the elementary-level film canister rockets activity, but adapted for middle school students.
In past times, ocean navigators tossed a piece of wood over the …
In past times, ocean navigators tossed a piece of wood over the side of their ships and noted how long until the ship passed the wood. They used this time measurement and the length of the ship to calculate their speed and estimate how far they had traveled. In this activity, students act the part of a GPS signal traveling to the receiver to learn how travel time is converted to distance.
In this unit, students will read and interpret primary sources to address …
In this unit, students will read and interpret primary sources to address the question “How do we measure the attainment of human rights?” By exploring the Universal Declaration of Human Rights, the UN’s Guide to Indicators of Human Rights, and data about development indicators from multiple databases, students will unpack the complexities of using indicators to measure human rights.
No restrictions on your remixing, redistributing, or making derivative works. Give credit to the author, as required.
Your remixing, redistributing, or making derivatives works comes with some restrictions, including how it is shared.
Your redistributing comes with some restrictions. Do not remix or make derivative works.
Most restrictive license type. Prohibits most uses, sharing, and any changes.
Copyrighted materials, available under Fair Use and the TEACH Act for US-based educators, or other custom arrangements. Go to the resource provider to see their individual restrictions.