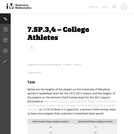
n this task, students are able to conjecture about the differences in …
n this task, students are able to conjecture about the differences in the two groups from a strictly visual perspective and then support their comparisons with appropriate measures of center and variability. This will reinforce that much can be gleaned simply from visual comparison of appropraite graphs, particularly those of similar scale. Students are also encouraged to consider how certain measurements and observation values from one group compare in the context of the other group.
This lesson unit is intended to help you assess how well students …
This lesson unit is intended to help you assess how well students are able to: solve simple problems involving ratio and direct proportion; choose an appropriate sampling method; and collect discrete data and record them using a frequency table.
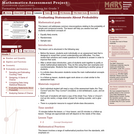
This lesson unit addresses common misconceptions relating to probability of simple and …
This lesson unit addresses common misconceptions relating to probability of simple and compound events. The lesson will help you assess how well students understand concepts of: Equally likely events; randomness; and sample sizes.
Four full-year digital course, built from the ground up and fully-aligned to …
Four full-year digital course, built from the ground up and fully-aligned to the Common Core State Standards, for 7th grade Mathematics. Created using research-based approaches to teaching and learning, the Open Access Common Core Course for Mathematics is designed with student-centered learning in mind, including activities for students to develop valuable 21st century skills and academic mindset.
Samples and ProbabilityType of Unit: ConceptualPrior KnowledgeStudents should be able to:Understand the …
Samples and ProbabilityType of Unit: ConceptualPrior KnowledgeStudents should be able to:Understand the concept of a ratio.Write ratios as percents.Describe data using measures of center.Display and interpret data in dot plots, histograms, and box plots.Lesson FlowStudents begin to think about probability by considering the relative likelihood of familiar events on the continuum between impossible and certain. Students begin to formalize this understanding of probability. They are introduced to the concept of probability as a measure of likelihood, and how to calculate probability of equally likely events using a ratio. The terms (impossible, certain, etc.) are given numerical values. Next, students compare expected results to actual results by calculating the probability of an event and conducting an experiment. Students explore the probability of outcomes that are not equally likely. They collect data to estimate the experimental probabilities. They use ratio and proportion to predict results for a large number of trials. Students learn about compound events. They use tree diagrams, tables, and systematic lists as tools to find the sample space. They determine the theoretical probability of first independent, and then dependent events. In Lesson 10 students identify a question to investigate for a unit project and submit a proposal. They then complete a Self Check. In Lesson 11, students review the results of the Self Check, solve a related problem, and take a Quiz.Students are introduced to the concept of sampling as a method of determining characteristics of a population. They consider how a sample can be random or biased, and think about methods for randomly sampling a population to ensure that it is representative. In Lesson 13, students collect and analyze data for their unit project. Students begin to apply their knowledge of statistics learned in sixth grade. They determine the typical class score from a sample of the population, and reason about the representativeness of the sample. Then, students begin to develop intuition about appropriate sample size by conducting an experiment. They compare different sample sizes, and decide whether increasing the sample size improves the results. In Lesson 16 and Lesson 17, students compare two data sets using any tools they wish. Students will be reminded of Mean Average Deviation (MAD), which will be a useful tool in this situation. Students complete another Self Check, review the results of their Self Check, and solve additional problems. The unit ends with three days for students to work on Gallery problems, possibly using one of the days to complete their project or get help on their project if needed, two days for students to present their unit projects to the class, and one day for the End of Unit Assessment.
Students estimate the length of 20 seconds by starting an unseen timer …
Students estimate the length of 20 seconds by starting an unseen timer and stopping it when they think 20 seconds has elapsed. They are shown the results and repeat the process two more times. The first and third times are recorded and compiled, producing two data sets to be compared. Students analyze the data to conclude whether or not their ability to estimate 20 seconds improves with practice.Key ConceptsMeasures of center and spreadLine plots, box plots, and histogramsMean absolute deviation (MAD)Goals and Learning ObjectivesApply knowledge of statistics to compare sets of data.Use measures of center and spread to analyze data.Decide which graph is appropriate for a given situation.
Students will apply their knowledge of statistics learned in sixth grade. They …
Students will apply their knowledge of statistics learned in sixth grade. They will determine the typical class score from a sample of the population, and reason about the representativeness of the sample.Students analyze test score data from a fictitious seventh grade class and make generalizations about district-wide results. They then compare the data to a second seventh grade class and reason about whether these are random samples. Students will review measures of center and spread as they find evidence to draw conclusions about the data.Key ConceptsSample size will be considered as it affects the conclusions of an analysis of a population.Students will review tools that they used in sixth grade to analyze data, such as measures of center and spread, and different types of graphs.Goals and Learning ObjectivesExplore sample size.Look at the effects of using a nonrandom sample.Review tools used to analyze data.
Students estimate the length of 50 seconds by starting an unseen timer …
Students estimate the length of 50 seconds by starting an unseen timer and stopping it when they think 50 seconds has elapsed. The third attempt is recorded and compiled into a data set, which students then compare to the third attempt from the previous lesson when they estimated the length of 20 seconds. Students analyze the data to make conclusions about how well seventh grade students can estimate lengths of time.Students repeat the timing activity for 50 seconds, but only the third trial is recorded. The task today is to compare this set of data with the third trial for 20 seconds. Students will need to deal with the difference in the spread of data, as well as how to compare the data sets. Students will be reminded of Mean Absolute Deviation (MAD), which will be a useful tool in this situation.Key ConceptsStudents apply the tools learned in Unit 6.8:Measures of center and spreadMean absolute deviation (MAD)Goals and Learning ObjectivesApply knowledge of statistics to compare different sets of data.Use measures of center and spread to analyze data.
Our project involves students learning about the values of a natural area …
Our project involves students learning about the values of a natural area in their community and producing a public service announcement and map to show its value and how it could be developed.
The intent of clarifying statements is to provide additional guidance for educators …
The intent of clarifying statements is to provide additional guidance for educators to communicate the intent of the standard to support the future development of curricular resources and assessments aligned to the 2021 math standards. Clarifying statements can be in the form of succinct sentences or paragraphs that attend to one of four types of clarifications: (1) Student Experiences; (2) Examples; (3) Boundaries; and (4) Connection to Math Practices.
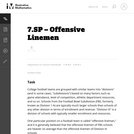
In this task, students are able to conjecture about the differences and …
In this task, students are able to conjecture about the differences and similarities in the two groups from a strictly visual perspective and then support their comparisons with appropriate measures of center and variability. This will reinforce that much can be gleaned simply from visual comparison of appropriate graphs, particularly those of similar scale.
Students will explore the overarching question, is the internet trustworthy?, while expanding …
Students will explore the overarching question, is the internet trustworthy?, while expanding their knowledge of statistics and comparing data sets. They will compare two data sets as well as determine the accuracy or bias of data representations shown on the internet. Students will then have the opportunity to apply their knowledge while creating their own visual representations for data they personally collected regarding the trustworthiness of the internet. The module concludes with a peer showcase and the post-assessment.
No restrictions on your remixing, redistributing, or making derivative works. Give credit to the author, as required.
Your remixing, redistributing, or making derivatives works comes with some restrictions, including how it is shared.
Your redistributing comes with some restrictions. Do not remix or make derivative works.
Most restrictive license type. Prohibits most uses, sharing, and any changes.
Copyrighted materials, available under Fair Use and the TEACH Act for US-based educators, or other custom arrangements. Go to the resource provider to see their individual restrictions.