This lesson unit is intended to help teachers assess how well students …
This lesson unit is intended to help teachers assess how well students are able to interpret percent increase and decrease, and in particular, to identify and help students who have the following difficulties: translating between percents, decimals, and fractions; representing percent increase and decrease as multiplication; and recognizing the relationship between increases and decreases.
Students learn about radar imaging and its various military and civilian applications …
Students learn about radar imaging and its various military and civilian applications that include recognition and detection of human-made targets, and the monitoring of space, deforestation and oil spills. They learn how the concepts of similarity and scaling are used in radar imaging to create three-dimensional models of various targets. Students apply the critical attributes of similar figures to create scale models of a radar imaging scenario using infrared range sensors (to emulate radar functions) and toy airplanes (to emulate targets). They use technology tools to measure angles and distances, and relate the concept of similar figures to real-world applications.
Four full-year digital course, built from the ground up and fully-aligned to …
Four full-year digital course, built from the ground up and fully-aligned to the Common Core State Standards, for 7th grade Mathematics. Created using research-based approaches to teaching and learning, the Open Access Common Core Course for Mathematics is designed with student-centered learning in mind, including activities for students to develop valuable 21st century skills and academic mindset.
Getting Started Type of Unit: Introduction Prior Knowledge Students should be able …
Getting Started
Type of Unit: Introduction
Prior Knowledge
Students should be able to:
Understand ratio concepts and use ratios. Use ratio and rate reasoning to solve real-world problems. Identify and use the multiplication property of equality.
Lesson Flow
This unit introduces students to the routines that build a successful classroom math community, and it introduces the basic features of the digital course that students will use throughout the year.
An introductory card sort activity matches students with their partner for the week. Then over the course of the week, students learn about the routines of Opening, Work Time, Ways of Thinking, Apply the Learning (some lessons), Summary of the Math, Reflection, and Exercises. Students learn how to present their work to the class, the importance of students’ taking responsibility for their own learning, and how to effectively participate in the classroom math community.
Students then work on Gallery problems, to further explore the resources and tools and to learn how to organize their work.
The mathematical work of the unit focuses on ratios and rates, including card sort activities in which students identify equivalent ratios and match different representations of an equivalent ratio. Students use the multiplication property of equality to justify solutions to real-world ratio problems.
Discuss the important ways that listeners contribute to mathematical discussions during Ways …
Discuss the important ways that listeners contribute to mathematical discussions during Ways of Thinking presentations. Then use ratio and rate reasoning to solve a problem about ingredients in a stew.Key ConceptsStudents find the unit rate of a ratio situation.Goals and Learning ObjectivesContribute as listeners during the Ways of Thinking discussion.Understand the concept of a unit rate that is associated with a ratio.Use rate reasoning to solve real-world problems.
Proportional Relationships Type of Unit: Concept Prior Knowledge Students should be able …
Proportional Relationships
Type of Unit: Concept
Prior Knowledge
Students should be able to:
Understand what a rate and ratio are. Make a ratio table. Make a graph using values from a ratio table.
Lesson Flow
Students start the unit by predicting what will happen in certain situations. They intuitively discover they can predict the situations that are proportional and might have a hard time predicting the ones that are not. In Lessons 2–4, students use the same three situations to explore proportional relationships. Two of the relationships are proportional and one is not. They look at these situations in tables, equations, and graphs. After Lesson 4, students realize a proportional relationship is represented on a graph as a straight line that passes through the origin. In Lesson 5, they look at straight lines that do not represent a proportional relationship. Lesson 6 focuses on the idea of how a proportion that they solved in sixth grade relates to a proportional relationship. They follow that by looking at rates expressed as fractions, finding the unit rate (the constant of proportionality), and then using the constant of proportionality to solve a problem. In Lesson 8, students fine-tune their definition of proportional relationship by looking at situations and determining if they represent proportional relationships and justifying their reasoning. They then apply what they have learned to a situation about flags and stars and extend that thinking to comparing two prices—examining the equations and the graphs. The Putting It Together lesson has them solve two problems and then critique other student work.
Gallery 1 provides students with additional proportional relationship problems.
The second part of the unit works with percents. First, percents are tied to proportional relationships, and then students examine percent situations as formulas, graphs, and tables. They then move to a new context—salary increase—and see the similarities with sales taxes. Next, students explore percent decrease, and then they analyze inaccurate statements involving percents, explaining why the statements are incorrect. Students end this sequence of lessons with a formative assessment that focuses on percent increase and percent decrease and ties it to decimals.
Students have ample opportunities to check, deepen, and apply their understanding of proportional relationships, including percents, with the selection of problems in Gallery 2.
Students analyze the graph of a proportional relationship in order to find …
Students analyze the graph of a proportional relationship in order to find the approximate constant of proportionality, to write the related formula, and to create a table of values that lie on the graph.Key ConceptsThe constant of proportionality determines the steepness of the straight-line graph that represents a proportional relationship. The steeper the line is, the greater the constant of proportionality.On the graph of a proportional relationship, the constant of proportionality is the constant ratio of y to x, or the slope of the line.A proportional relationship can be represented in different ways: a ratio table, a graph of a straight line through the origin, or an equation of the form y = kx, where k is the constant of proportionality.Goals and Learning ObjectivesIdentify the constant of proportionality from a graph that represents a proportional relationship.Write a formula for a graph that represents a proportional relationship.Make a table for a graph that represents a proportional relationship.Relate the constant of proportionality to the steepness of a graph that represents a proportional relationship (i.e., the steeper the line is, the greater the constant of proportionality).
Students connect percent to proportional relationships in the context of sales tax.Key …
Students connect percent to proportional relationships in the context of sales tax.Key ConceptsWhen there is a constant tax percent, the total cost for items purchase—including the price and the tax—is proportional to the price.To find the cost, c , multiply the price of the item, p, by (1 + t), where t is the tax percent, written as a decimal: c = p(1 + t).The constant of proportionality is (1 + t) because of the structure of the situation:c = p + tp = p(1 + t).Because of the distributive property, multiplying the price by (1 + t) means multiplying the price by 1, then multiplying the price by t, and then taking the sum of these products.Goals and Learning ObjectivesFind the total cost in a sales tax situation.Understand that a proportional relationship only exists between the price of an item and the total cost of the item if the sales tax is constant.Find the constant of proportionality in a sales tax situation.Make a graph of an equation showing the relationship between the price of an item and the total amount paid.
Lesson OverviewStudents calculate the constant of proportionality for a proportional relationship based …
Lesson OverviewStudents calculate the constant of proportionality for a proportional relationship based on a table of values and use it to write a formula that represents the proportional relationship.Key ConceptsIf two quantities are proportional to one another, the relationship between them can be defined by a formula of the form y = kx, where k is the constant ratio of y-values to corresponding x-values. The same relationship can also be defined by the formula x=(1k)y , where 1k is now the constant ratio of x-values to y-values.Goals and Learning ObjectivesDefine the constant of proportionality.Calculate the constant of proportionality from a table of values.Write a formula using the constant of proportionality.
Students write the relationship between two fractions as a unit rate and …
Students write the relationship between two fractions as a unit rate and use unit rates and the constant of proportionality to solve problems involving proportional relationships.Key ConceptsIn situations where there is a constant rate involved, the unit rate is a constant of proportionality between the two variable quantities and can be used to write a formula of the form y = kx.A given constant rate can be simplified to find the unit rate by expressing its value with a denominator of 1.The ratios of two fractions can be expressed as a unit rate.Goals and Learning ObjectivesExpress the ratios of two fractions as a unit rate.Understand that when a constant rate is involved, the unit rate is the constant of proportionality.Use the unit rate to write and solve a formula of the form y = kx.
Students look at the relationship between the number of flags manufactured and …
Students look at the relationship between the number of flags manufactured and the stars on the flag and determine whether it represents a proportional relationship.Key ConceptsThe form of the equation of a proportional relation is y = kx, where k is the constant of proportionality.A graph of a proportional relationship is a straight line that passes through the origin.The constant of a proportionality in a graph of a proportional relationship is the constant ratio of y to x (the slope of the line).Goals and Learning ObjectivesIdentify the constant of proportionality in a proportional relationship based on a real-world problem situation.Write a formula using the constant of proportionality.Analyze a graph of a proportional relationship.Make a graph and determine if it represents a proportional relationship.Identify the constant of proportionality in a graph of a proportional relationship.
Students explore the idea that not all straight lines are proportional by …
Students explore the idea that not all straight lines are proportional by comparing a graph representing a stack of books with a graph representing a stack of cups. They recognize that all proportional relationships are represented as a straight line that passes through the origin.Key ConceptsNot all graphs of straight lines represent proportional relationships.There are three ways to tell whether a relationship between two varying quantities is proportional:The graph of the relationship between the quantities is a straight line that passes through the point (0, 0).You can express one quantity in terms of the other using a formula of the form y = kx.The ratios between the varying quantities are constant.Goals and Learning ObjectivesUnderstand when a graph of a straight line is and when it is not a proportional relationship.Recognize that a proportional relationship is shown on a graph as a straight line that passes through the origin (0, 0).Make a table of values to represent two quantities that vary.Graph a table of values representing two quantities that vary.Describe what each variable and number in a formula represents.
Students continue to explore the three relationships from the previous lessons: Comparing …
Students continue to explore the three relationships from the previous lessons: Comparing Dimensions, Driving to the Amusement Park, and Temperatures at the Amusement Park. They graph the three situations and realize that the two proportional relationships form a straight line, but the time and temperature relationship does not.Key ConceptsA table of values that represent equivalent ratios can be graphed in the coordinate plane. The graph represents a proportional relationship in the form of a straight line that passes through the origin (0, 0). The unit rate is the slope of the line.Goals and Learning ObjectivesRepresent relationships shown in a table of values as a graph.Recognize that a proportional relationship is shown on a graph as a straight line that passes through the origin (0, 0).
Students have an opportunity to review their own work on the Self …
Students have an opportunity to review their own work on the Self Check in the previous lesson, consider feedback that addresses specific aspects of their work, examine a different approach to the problem from the Self Check, and then use what they learned to solve a closely related problem.Key ConceptsStudents reflect on their work, review and critique student work on the same problem, and then apply their learning to solve a similar problem.Goals and Learning ObjectivesUse teacher comments to refine their solution strategies for a proportional relationship problemDeepen their understanding of proportional relationships.Synthesize and connect strategies for representing and investigating proportional relationships.Critique given student work involving proportional relationships.Apply deepened understanding of proportional relationships to a new problem situation.
Students watch a video showing three different ways to solve a problem …
Students watch a video showing three different ways to solve a problem involving a proportional relationship, and then they use each method to solve a similar problem. Students describe each approach, including the mathematical terms associated with each.Key ConceptsThree methods for solving problems involving proportional relationships include:Setting up a proportion and solving for the missing valueFinding the unit rate and multiplyingWriting and solving a formula using the constant of proportionalityGoals and Learning ObjectivesSolve a problem involving a proportional relationship in three different ways: set up a proportion and solve for a missing value, use a unit rate, and use the constant of proportionality to write and solve a formula.
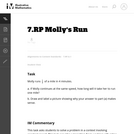
This task asks students to solve a problem in a context involving …
This task asks students to solve a problem in a context involving constant speed. This task provides a transition from working with ratios involving whole numbers to ratios involving fractions.
The intent of clarifying statements is to provide additional guidance for educators …
The intent of clarifying statements is to provide additional guidance for educators to communicate the intent of the standard to support the future development of curricular resources and assessments aligned to the 2021 math standards. Clarifying statements can be in the form of succinct sentences or paragraphs that attend to one of four types of clarifications: (1) Student Experiences; (2) Examples; (3) Boundaries; and (4) Connection to Math Practices.
This lesson unit is intended to help teachers assess whether students are …
This lesson unit is intended to help teachers assess whether students are able to: identify when two quantities vary in direct proportion to each other; distinguish between direct proportion and other functional relationships; and solve proportionality problems using efficient methods.
No restrictions on your remixing, redistributing, or making derivative works. Give credit to the author, as required.
Your remixing, redistributing, or making derivatives works comes with some restrictions, including how it is shared.
Your redistributing comes with some restrictions. Do not remix or make derivative works.
Most restrictive license type. Prohibits most uses, sharing, and any changes.
Copyrighted materials, available under Fair Use and the TEACH Act for US-based educators, or other custom arrangements. Go to the resource provider to see their individual restrictions.