This is a task from the Illustrative Mathematics website that is one …
This is a task from the Illustrative Mathematics website that is one part of a complete illustration of the standard to which it is aligned. Each task has at least one solution and some commentary that addresses important aspects of the task and its potential use.
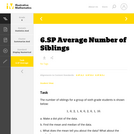
The students will use ACC basketball statistics to practice the process of …
The students will use ACC basketball statistics to practice the process of converting fractions to decimals then to percents and will learn how to create and edit a spreadsheet. They will then use this spreadsheet to analyze their data. This unit is done during the basketball season which takes approximately 15 weeks from the middle of November to the middle of March. Teachers must have Clarisworks to open the sample spreadsheet in the lesson, but may recreate it in another spreadsheet program.
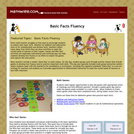
Every math teacher struggles to find ways to encourage students to master …
Every math teacher struggles to find ways to encourage students to master their basic facts. Whether for addition and subtraction facts or for multiplication and division facts, teachers collect many ideas from which they can draw activities to meet the varied needs of learners in their classes. Games and Who Has? activities are especially motivational and continual play can help students develop fact fluency in an effort to master the games and capture the most points.
This is a task from the Illustrative Mathematics website that is one …
This is a task from the Illustrative Mathematics website that is one part of a complete illustration of the standard to which it is aligned. Each task has at least one solution and some commentary that addresses important aspects of the task and its potential use.
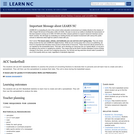
n addition to providing a task that relates to other disciplines (history, …
n addition to providing a task that relates to other disciplines (history, civics, current events, etc.), this task is intended to demonstrate that a graph can summarize a distribution as well as provide useful information about specific observations.
This is a task from the Illustrative Mathematics website that is one …
This is a task from the Illustrative Mathematics website that is one part of a complete illustration of the standard to which it is aligned. Each task has at least one solution and some commentary that addresses important aspects of the task and its potential use.
Distributions and Variability Type of Unit: Project Prior Knowledge Students should be …
Distributions and Variability
Type of Unit: Project
Prior Knowledge
Students should be able to:
Represent and interpret data using a line plot. Understand other visual representations of data.
Lesson Flow
Students begin the unit by discussing what constitutes a statistical question. In order to answer statistical questions, data must be gathered in a consistent and accurate manner and then analyzed using appropriate tools.
Students learn different tools for analyzing data, including:
Measures of center: mean (average), median, mode Measures of spread: mean absolute deviation, lower and upper extremes, lower and upper quartile, interquartile range Visual representations: line plot, box plot, histogram
These tools are compared and contrasted to better understand the benefits and limitations of each. Analyzing different data sets using these tools will develop an understanding for which ones are the most appropriate to interpret the given data.
To demonstrate their understanding of the concepts, students will work on a project for the duration of the unit. The project will involve identifying an appropriate statistical question, collecting data, analyzing data, and presenting the results. It will serve as the final assessment.
Students make a box plot for their typical-sixth-grader data from Lesson 7 …
Students make a box plot for their typical-sixth-grader data from Lesson 7 and write a summary of what the plot shows.Using the line plot from Lesson 4, students construct a box plot. Students learn how to calculate the five-number summary and interquartile range (IQR). Students apply this knowledge to the data used in Lesson 7 and describe the data in terms of the box plot. Class discussion focuses on comparing the two graphs and what they show for the sets of data.Key ConceptsA box-and-whisker plot, or box plot, shows the spread of a set of data. It shows five key measures, called the five-number summary.Lower extreme: The smallest value in the data setLower quartile: The middle of the lower half of the data, and the value that 25% of the data fall belowMedian: The middle of the data setUpper quartile: The middle of the upper half of the data, and the value that 25% of the data are aboveUpper extreme: The greatest value in the data setThis diagram shows how these values relate to the parts of a box plot.The length of the box represents the interquartile range (IQR), which is the difference between the lower and upper quartile.A box plot divides the data into four equal parts. One quarter of the data is represented by the left whisker, two quarters by each half of the box, and one quarter by the right whisker. If one of these parts is long, the data in that quarter are spread out. If one of these quarters is short, the data in that quarter are clustered together.Goals and Learning ObjectivesLearn how to construct box plots, another tool to describe data.Learn about the five-number summary, interquartile range, and how they are related to box plots.Compare a line plot and box plot for the same set of data.
Students critique and improve their work on the Self Check from Lesson …
Students critique and improve their work on the Self Check from Lesson 13.Key ConceptsMeasures of spread (five-number summary) show characteristics of the data. It is possible to generate an appropriate data set with this information.Goals and Learning ObjectivesApply knowledge of statistics to solve problems.Identify the five-number summary, and understand measures of center and use their properties to solve problems.Track and review choice of strategy when problem solving.
Students use the Box Plot interactive, which allows them to create line …
Students use the Box Plot interactive, which allows them to create line plots and see the corresponding box plots. They use this tool to create data sets with box plots that satisfy given criteria.Students investigate how the box plot changes as the data points in the line plot are moved. Students can manipulate data points to change aspects of the box plot and to see how the line plot changes. Students create box plots that fit certain criteria.Key ConceptsThis lesson focuses on the connection between a data set and its box plot. It reinforces the idea that a box plot shows the spread of a data set, but not the individual data points.Students will observe the following similarities and differences between line plots and box plots:Line plots allow us to see and count individual values, while box plots do not.Line plots allow us to find the mean and the mode of a set of data, while box plots do not.Box plots are useful for very large data sets, while line plots are not.Box plots give us a better picture of how the values in a data set are distributed than line plots do, and they allow us to see measures of spread easily.Goals and Learning ObjectivesExperiment with different line plots to see the effect on the corresponding box plots.Create data sets with box plots that satisfy different criteria.Compare and contrast line plots and box plots.
Lesson OverviewStudents complete a card sort that requires them to match sets …
Lesson OverviewStudents complete a card sort that requires them to match sets of statistics with the corresponding line plots.Students match cards with simple line plots to the corresponding card with measures of center. Some cards include mode, mean, median, and range, and some have one or two measures missing. Students discuss how they determined which cards would match.Key ConceptsTo complete the card sort in this lesson efficiently, students must be able to relate statistical measures with line plots. If they start with the measures that are easy to see, they can narrow down the possible matches.The mode is the easiest measure to see immediately. It is simply the number with the tallest column of dots.The range can be found easily by subtracting the least value in the plot from the greatest.The median can be found fairly quickly by counting to the middle dot or by pairing dots on the ends until reaching the middle.The mean must be calculated by adding data values and dividing.Goals and Learning ObjectivesApply knowledge of measures of center and range to solve problems.Discuss and review strategy choices when problem solving.
Students will apply what they have learned in previous lessons to analyze …
Students will apply what they have learned in previous lessons to analyze and draw conclusions about a set of data. They will also justify their thinking based on what they know about the measures (e.g., I know the mean is a good number to use to describe what is typical because the range is narrow and so the MAD is low.).Students analyze one of the data sets about the characteristics of sixth grade students that was collected by the class in Lesson 2. Students construct line plots and calculate measures of center and spread in order to further their understanding of the characteristics of a typical sixth grade student.Key ConceptsNo new mathematical ideas are introduced in this lesson. Instead, students apply the skills they have acquired in previous lessons to analyze a data set for one attribute of a sixth grade student. Students make a line plot of the data and find the mean, median, range, MAD, and outliers. They use these results to determine a typical value for their data.Goals and Learning ObjectivesDescribe an attribute of a typical sixth grade student using line plots and measures of center (mean and median) and spread (range and MAD).Justify thinking about which measures are good descriptors of the data set.
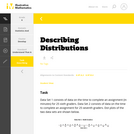
This lesson unit is intended to help you assess how well students …
This lesson unit is intended to help you assess how well students are able to: Calculate the mean, median, mode, and range from a frequency chart; and to use a frequency chart to describe a possible data set, given information on the mean, median, mode, and range.
The intent of clarifying statements is to provide additional guidance for educators …
The intent of clarifying statements is to provide additional guidance for educators to communicate the intent of the standard to support the future development of curricular resources and assessments aligned to the 2021 math standards. Clarifying statements can be in the form of succinct sentences or paragraphs that attend to one of four types of clarifications: (1) Student Experiences; (2) Examples; (3) Boundaries; and (4) Connection to Math Practices.
No restrictions on your remixing, redistributing, or making derivative works. Give credit to the author, as required.
Your remixing, redistributing, or making derivatives works comes with some restrictions, including how it is shared.
Your redistributing comes with some restrictions. Do not remix or make derivative works.
Most restrictive license type. Prohibits most uses, sharing, and any changes.
Copyrighted materials, available under Fair Use and the TEACH Act for US-based educators, or other custom arrangements. Go to the resource provider to see their individual restrictions.