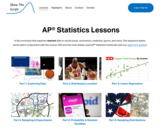
A full AP® Statistics curriculum that explores relevant data in social issues, …
A full AP® Statistics curriculum that explores relevant data in social issues, economics, medicine, sports, and more. The sequence works well in conjunction with the course CED and the most widely-used AP® Statistics textbooks.
Students explore Hooke's law while working in small groups at their lab …
Students explore Hooke's law while working in small groups at their lab benches. They collect displacement data for springs with unknown spring constants, k, by adding various masses of known weight. After exploring Hooke's law and answering a series of application questions, students apply their new understanding to explore a tissue of known surface area. Students then use the necessary relationships to depict a cancerous tumor amidst normal tissue by creating a graph in Microsoft Excel.
This lesson unit is intended to help teachers assess how well students …
This lesson unit is intended to help teachers assess how well students understand the notion of correlation. In particular this unit aims to identify and help students who have difficulty in: understanding correlation as the degree of fit between two variables; making a mathematical model of a situation; testing and improving the model; communicating their reasoning clearly; and evaluating alternative models of the situation.
This lesson unit is intended to help teachers assess how well students …
This lesson unit is intended to help teachers assess how well students are able to: interpret data and evaluate statistical summaries; and critique someone elseŐs interpretations of data and evaluations of statistical summaries. The lesson also introduces students to the dangers of misapplying simple statistics in real-world contexts, and illustrates some of the common abuses of statistics and charts found in the media.
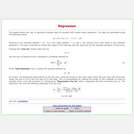
This applet from Statistical Java allows the user to generate bivariate data …
This applet from Statistical Java allows the user to generate bivariate data for analysis with simple linear regression. The page describes the equations used to generate the data and estimate the regression lines.
Students learn about two types of friction static and kinetic and the …
Students learn about two types of friction static and kinetic and the equation that governs them. They also measure the coefficient of static friction experimentally.
In this activity, students use an old fashion children's toy, a metal …
In this activity, students use an old fashion children's toy, a metal slinky, to mimic and understand the magnetic field generated in an MRI machine. The metal slinky mimics the magnetic field of a solenoid, which forms the basis for the magnet of the MRI machine. Students run current through the slinky and use computer and calculator software to explore the magnetic field created by the slinky.
Students build on their existing air quality knowledge and a description of …
Students build on their existing air quality knowledge and a description of a data set to each develop a hypothesis around how and why air pollutants vary on a daily and seasonal basis. Then they are guided by a worksheet through an Excel-based analysis of the data. This includes entering formulas to calculate statistics and creating plots of the data. As students complete each phase of the analysis, reflection questions guide their understanding of what new information the analysis reveals. At activity end, students evaluate their original hypotheses and “put all of the pieces together.” The activity includes one carbon dioxide worksheet/data set and one ozone worksheet/data set; providing students and/or instructors with a content option. The activity also serves as a good standalone introduction to using Excel.
No restrictions on your remixing, redistributing, or making derivative works. Give credit to the author, as required.
Your remixing, redistributing, or making derivatives works comes with some restrictions, including how it is shared.
Your redistributing comes with some restrictions. Do not remix or make derivative works.
Most restrictive license type. Prohibits most uses, sharing, and any changes.
Copyrighted materials, available under Fair Use and the TEACH Act for US-based educators, or other custom arrangements. Go to the resource provider to see their individual restrictions.