A full AP® Statistics curriculum that explores relevant data in social issues, …
A full AP® Statistics curriculum that explores relevant data in social issues, economics, medicine, sports, and more. The sequence works well in conjunction with the course CED and the most widely-used AP® Statistics textbooks.
This task examines, from a mathematical and statistical point of view, how …
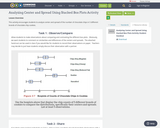
This task examines, from a mathematical and statistical point of view, how scientists measure the age of organic materials by measuring the ratio of Carbon 14 to Carbon 12. The focus here is on the statistical nature of such dating. This task addresses a very important issue about precision in reporting and understanding statements in a realistic scientific context.
In this module, students reconnect with and deepen their understanding of statistics …
In this module, students reconnect with and deepen their understanding of statistics and probability concepts first introduced in Grades 6, 7, and 8. Students develop a set of tools for understanding and interpreting variability in data, and begin to make more informed decisions from data. They work with data distributions of various shapes, centers, and spreads. Students build on their experience with bivariate quantitative data from Grade 8. This module sets the stage for more extensive work with sampling and inference in later grades.
Find the rest of the EngageNY Mathematics resources at https://archive.org/details/engageny-mathematics.
Using a website simulation tool, students build on their understanding of random …
Using a website simulation tool, students build on their understanding of random processes on networks to interact with the graph of a social network of individuals and simulate the spread of a disease. They decide which two individuals on the network are the best to vaccinate in an attempt to minimize the number of people infected and "curb the epidemic." Since the results are random, they run multiple simulations and compute the average number of infected individuals before analyzing the results and assessing the effectiveness of their vaccination strategies.
This lesson unit is intended to help teachers assess how well students …
This lesson unit is intended to help teachers assess how well students understand the notion of correlation. In particular this unit aims to identify and help students who have difficulty in: understanding correlation as the degree of fit between two variables; making a mathematical model of a situation; testing and improving the model; communicating their reasoning clearly; and evaluating alternative models of the situation.
This task requires students to use the normal distribution as a model …
This task requires students to use the normal distribution as a model for a data distribution. Students must use given means and standard deviations to approximate population percentages. There are several ways (tables, graphing calculators, or statistical software) that students might calculate the required normal percentages. Depending on the method used, answers might vary somewhat from those shown in the solution.
This problem could be used as an introductory lesson to introduce group …
This problem could be used as an introductory lesson to introduce group comparisons and to engage students in a question they may find amusing and interesting. More generally, the idea of the lesson could be used as a template for a project where students develop a questionnaire, sample students at their school and report on their findings.
This lesson unit is intended to help teachers assess how well students …
This lesson unit is intended to help teachers assess how well students are able to: interpret data and evaluate statistical summaries; and critique someone elseŐs interpretations of data and evaluations of statistical summaries. The lesson also introduces students to the dangers of misapplying simple statistics in real-world contexts, and illustrates some of the common abuses of statistics and charts found in the media.
Students explore electromagnetism and engineering concepts using optimization techniques to design an …
Students explore electromagnetism and engineering concepts using optimization techniques to design an efficient magnetic launcher. Groups start by algebraically solving the equations of motion for the velocity at the time when a projectile leaves a launcher. Then they test three different launchers, in which the number of coils used is different, measuring the range and comparing the three designs. Based on these observations, students record similarities and differences and hypothesize on the underling physics. They are introduced to Faraday's law and Lenz's law to explain the physics behind the launcher. Students brainstorm how these principals might be applied to real-world engineering problems.
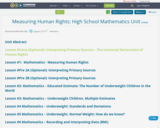
In this unit, students will read and interpret primary sources to address …
In this unit, students will read and interpret primary sources to address the question “How do we measure the attainment of human rights?” By exploring the Universal Declaration of Human Rights, the UN’s Guide to Indicators of Human Rights, and data about development indicators from multiple databases, students will unpack the complexities of using indicators to measure human rights.
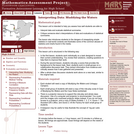
The intent of clarifying statements is to provide additional guidance for educators …
The intent of clarifying statements is to provide additional guidance for educators to communicate the intent of the standard to support the future development of curricular resources and assessments aligned to the 2021 math standards. Clarifying statements can be in the form of succinct sentences or paragraphs that attend to one of four types of clarifications: (1) Student Experiences; (2) Examples; (3) Boundaries; and (4) Connection to Math Practices.
Acting as civil engineers hired by the U.S. Department of Transportation to …
Acting as civil engineers hired by the U.S. Department of Transportation to research how to best use piezoelectric materials to detect road damage, student groups are challenged to independently create their own experiment procedures, working with given materials and tools. The general approach is that they set up model roads using rubber mats to simulate asphalt and piezoelectric transducers to simulate the in-ground road sensors. They drop heavy bolts at various locations on the “road,” collecting data and then analyzing the voltage changes across the piezoelectric transducers caused by the vibrations of the bolt hitting the rubber. After making notches in the rubber “road” to simulate cracks and potholes, they collect more data to see if the piezo elements detect the damage. Students write up their research and conclusions as if presenting evidence to USDOT officials about how the voltage changes across the piezo elements can be used to indicate road damage and extrapolated to determine when roads need maintenance service.
This task provides a context to calculate discrete probabilities and represent them …
This task provides a context to calculate discrete probabilities and represent them on a bar graph. It could also be used to create a class activity where students gather, represent, and analyze data, running simulations of the random walk and recording and then displaying their results.
No restrictions on your remixing, redistributing, or making derivative works. Give credit to the author, as required.
Your remixing, redistributing, or making derivatives works comes with some restrictions, including how it is shared.
Your redistributing comes with some restrictions. Do not remix or make derivative works.
Most restrictive license type. Prohibits most uses, sharing, and any changes.
Copyrighted materials, available under Fair Use and the TEACH Act for US-based educators, or other custom arrangements. Go to the resource provider to see their individual restrictions.