Remix
- Number of visits 1
- Number of saves 2
- 0
Description
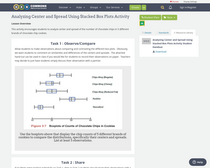
- Overview:
- This activity encourages students to analyze center and spread of the number of chocolate chips in 5 different brands of chocolate chip cookies.
- Remix of:
- AEA Template for Building Lessons
- Subject:
- Statistics and Probability
- Level:
- High School
- Grades:
- Grade 11, Grade 12
- Material Type:
- Lesson Plan
- Author:
- Samantha Jensen
- Date Added:
- 10/18/2018
- License:
-
Creative Commons Attribution Non-Commercial

- Language:
- English

Standards
Evaluations
No evaluations yet.
Comments