In this lesson, they work with equivalent ratios more abstractly, both in …
In this lesson, they work with equivalent ratios more abstractly, both in the context of recipes and in the context of abstract ratios of numbers. They understand and articulate that all ratios that are equivalent to a:b can be generated by multiplying both aand b by the same number (MP6).By connecting concrete quantitative experiences to abstract representations that are independent of a context, students develop their skills in reasoning abstractly and quantitatively (MP2). They continue to use diagrams, words, or a combination of both for their explanations. The goal in subsequent lessons is to develop a general definition of equivalent ratios.
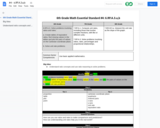
Solve problems involving ratios and rates. a. Create tables of equivalent ratios, …
Solve problems involving ratios and rates.
a. Create tables of equivalent ratios, find missing values in the tables and plot the pairs of values on the Cartesian coordinate plane. b. Solve unit rate problems.
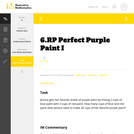
This is a task from the Illustrative Mathematics website that is one …
This is a task from the Illustrative Mathematics website that is one part of a complete illustration of the standard to which it is aligned. Each task has at least one solution and some commentary that addresses important aspects of the task and its potential use.
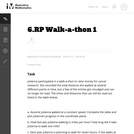
This is a task from the Illustrative Mathematics website that is one …
This is a task from the Illustrative Mathematics website that is one part of a complete illustration of the standard to which it is aligned. Each task has at least one solution and some commentary that addresses important asects of the task and its potential use. Here are the first few lines of the commentary for this task: Julianna participated in a walk-a-thon to raise money for cancer research. She recorded the total distance she walked at several different points in ti...
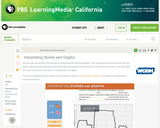
In this interactive activity adapted from Annenberg Learner's Teaching Math Grades 6–8, …
In this interactive activity adapted from Annenberg Learner's Teaching Math Grades 6–8, explore some of the ways graphs can represent mathematical data contained in a story.
Putting Math to Work Type of Unit: Problem Solving Prior Knowledge Students …
Putting Math to Work
Type of Unit: Problem Solving
Prior Knowledge
Students should be able to:
Solve problems with rational numbers using all four operations. Write ratios and rates. Use a rate table to solve problems. Write and solve proportions. Use multiple representations (e.g., tables, graphs, and equations) to display data. Identify the variables in a problem situation (i.e., dependent and independent variables). Write formulas to show the relationship between two variables, and use these formulas to solve for a problem situation. Draw and interpret graphs that show the relationship between two variables. Describe graphs that show proportional relationships, and use these graphs to make predictions. Interpret word problems, and organize information. Graph in all quadrants of the coordinate plane.
Lesson Flow
As a class, students use problem-solving steps to work through a problem about lightning. In the next lesson, they use the same problem-solving steps to solve a similar problem about lightning. The lightning problems use both rational numbers and rates. Students then choose a topic for a math project. Next, they solve two problems about gummy bears using the problem-solving steps. They then have 3 days of Gallery problems to test their problem-solving skills solo or with a partner. Encourage students to work on at least one problem individually so they can better prepare for a testing situation. The unit ends with project presentations and a short unit test.
Students work in a whole-class setting, independently, and with partners to design …
Students work in a whole-class setting, independently, and with partners to design and implement a problem-solving plan based on the mathematical concepts of rates and multiple representations (e.g., tables, equations, and graphs). They analyze a rule of thumb and use this relationship to calculate the distance in miles from a viewer's vantage point to lightning.Key ConceptsThroughout this unit, students are encouraged to apply the mathematical concepts they have learned over the course of this year to new settings. Help students develop and refine these problem-solving skills:Creating a problem-solving plan and implementing the plan systematicallyPersevering through challenging problems to find solutionsRecalling prior knowledge and applying that knowledge to new situationsMaking connections between previous learning and real-world problemsCommunicating their approaches with precision and articulating why their strategies and solutions are reasonableCreating efficacy and confidence in solving challenging problems in the real worldGoals and Learning ObjectivesCreate and implement a problem-solving plan.Organize and interpret data presented in a problem situation.Analyze the relationship between two variables.Create a rate table to organize data and make predictions.Apply the relationship between the variables to write a mathematical formula and use the formula to solve problems.Create a graph to display proportional relationships, and use this graph to make predictions.Articulate strategies, thought processes, and approaches to solving a problem, and defend why the solution is reasonable.
During this two-day lesson, students work with a partner to create and …
During this two-day lesson, students work with a partner to create and implement a problem-solving plan based on the mathematical concepts of rates, ratios, and proportionality. Students analyze the relationship between different-sized gummy bears to solve problems involving size and price.Key ConceptsThroughout this unit, students are encouraged to apply the mathematical concepts they have learned over the course of this year to new settings. Help students develop and refine these problem-solving skills:Creating a problem solving plan and implementing their plan systematicallyPersevering through challenging problems to find solutionsRecalling prior knowledge and applying that knowledge to new situationsMaking connections between previous learning and real-world problemsCommunicating their approaches with precision and articulating why their strategies and solutions are reasonableCreating efficacy and confidence in solving challenging problems in a real worldGoals and Learning ObjectivesCreate and implement a problem-solving plan.Organize and interpret data presented in a problem situation.Analyze the relationship between two variables.Use ratios.Write and solve proportions.Create rate tables to organize data and make predictions.Use multiple representations—including tables, graphs, and equations—to organize and communicate data.Articulate strategies, thought processes, and approaches to solving a problem, and defend why the solution is reasonable.
During this two-day lesson, students work with a partner to create and …
During this two-day lesson, students work with a partner to create and implement a problem-solving plan based on the mathematical concepts of rates, ratios, and proportionality. Students analyze the relationship between different-sized gummy bears to solve problems involving size and price.Key ConceptsThroughout this unit, students are encouraged to apply the mathematical concepts they have learned over the course of this year to new settings. Helping students develop and refine these problem solving skills:Creating a problem solving plan and implementing their plan systematicallyPersevering through challenging problems to find solutionsRecalling prior knowledge and applying that knowledge to new situationsMaking connections between previous learning and real-world problemsCommunicating their approaches with precision and articulating why their strategies and solutions are reasonableCreating efficacy and confidence in solving challenging problems in a real worldGoals and Learning ObjectivesCreate and implement a problem-solving plan.Organize and interpret data presented in a problem situation.Analyze the relationship between two variables.Use ratios.Write and solve proportions.Create rate tables to organize data and make predictionsUse multiple representations—including tables, graphs, and equations—to organize and communicate data.Articulate strategies, thought processes, and approaches to solving a problem and defend why the solution is reasonable.
Students create and implement a problem-solving plan to solve another problem involving …
Students create and implement a problem-solving plan to solve another problem involving the relationship between the sound of thunder and the distance of the lightning.Key ConceptsThroughout this unit, students are encouraged to apply the mathematical concepts they have learned over the course of this year to new settings. Help students develop and refine these problem-solving skills:Creating a problem-solving plan and implementing their plan systematicallyPersevering through challenging problems to find solutionsRecalling prior knowledge and applying that knowledge to new situationsMaking connections between previous learning and real-world problemsCommunicating their approaches with precision and articulating why their strategies and solutions are reasonableCreating efficacy and confidence in solving challenging problems in a real worldGoals and Learning ObjectivesCreate and implement a problem-solving plan.Organize and interpret data presented in a problem situation.Analyze the relationship between two variables.Create a rate table to organize data and make predictions.Apply the relationship between the variables to write a mathematical formula and use the formula to solve problems.Create a graph to display proportional relationships and use this graph to make predictions.Articulate strategies, thought processes, and approaches to solving a problem and defend why the solution is reasonable.
Rate Type of Unit: Concept Prior Knowledge Students should be able to: …
Rate
Type of Unit: Concept
Prior Knowledge
Students should be able to:
Solve problems involving all four operations with rational numbers. Understand quantity as a number used with a unit of measurement. Solve problems involving quantities such as distances, intervals of time, liquid volumes, masses of objects, and money, and with the units of measurement for these quantities. Understand that a ratio is a comparison of two quantities. Write ratios for problem situations. Make and interpret tables, graphs, and diagrams. Write and solve equations to represent problem situations.
Lesson Flow
In this unit, students will explore the concept of rate in a variety of contexts: beats per minute, unit prices, fuel efficiency of a car, population density, speed, and conversion factors. Students will write and refine their own definition for rate and then use it to recognize rates in different situations. Students will learn that every rate is paired with an inverse rate that is a measure of the same relationship. Students will figure out the logic of how units are used with rates. Then students will represent quantitative relationships involving rates, using tables, graphs, double number lines, and formulas, and they will see how to create one such representation when given another.
In this lesson, students write formulas to represent different rate relationships.Key ConceptsA …
In this lesson, students write formulas to represent different rate relationships.Key ConceptsA formula is a mathematical way of writing a rule for computing a value.Formulas, like c = 2.50w or d = 20g, describe the relationship between quantities.The formula c = 2.50w describes the relationship between a cost and a quantity that costs $2.50 per unit of weight. Here, w stands for any weight, and c stands for the cost of w pounds at $2.50 per pound.The formula d = 20g describes the relationship between the distance, d, and the number of gallons of gas, g, for a car that gets 20 miles per gallon.Goals and Learning ObjectivesUse equations with two variables to express relationships between quantities that vary together.
In this lesson, students first watch three racers racing against each other. …
In this lesson, students first watch three racers racing against each other. The race is shown on a track and represented on a graph. Students then change the speed, distance, and time to create a race with different results. They graph the new race and compare their graph to the original race graph.Key ConceptsA rate situation can be represented by a graph. Each point on a graph represents a pair of values. In today's situation, each point represents an amount of time and the distance a racer traveled in that amount of time. Time is usually plotted on the horizontal axis. The farther right a point is from the origin, the more time has passed from the start. Distance is usually plotted on the vertical axis. The higher up a point is from the origin, the farther the snail has traveled from the start. A graph of a constant speed is a straight line. Steeper lines show faster speeds.Goals and Learning ObjectivesUnderstand that a graph can be a visual representation of an actual rate situation.Plot pairs of related values on a graph.Use graphs to develop an understanding of rates.
Students use their knowledge of rates to solve problems.Key ConceptsGiven any two …
Students use their knowledge of rates to solve problems.Key ConceptsGiven any two values in a rate situation, you can find the third value.These three equations are equivalent, and they all describe rate relationships:y = rx, r = yx, x = yrAt the beginning of this lesson (or for homework), students will revise their work on the pre-assessment Self Check. Their revised work will provide data that you and your students can use to reassess students' understanding of rate. You can use this information to clear up any remaining misconceptions and to help students integrate their learning from the past several days into a deeper and more coherent whole.The work students do in this lesson and in revising their pre-assessments will help you and your students decide how to help them during the Gallery. In this lesson, students will reveal the depth and clarity of their understanding of rate.Students whose understanding of rate is still delicate should get extra help during the Gallery.Students who feel that they have a robust understanding of rate may choose from any of the problem-solving or deeper mathematics problems in the Gallery.Goals and Learning ObjectivesUncover any partial understandings and misconceptions about rate.Develop a more robust understanding of rate.Identify which Gallery problems to work on.
Ratios Type of Unit: Concept Prior Knowledge Students should be able to: …
Ratios
Type of Unit: Concept
Prior Knowledge
Students should be able to:
Calculate with whole numbers up to 100 using all four operations. Understand fraction notation and percents and translate among fractions, decimal numbers, and percents. Interpret and use a number line. Use tables to solve problems. Use tape diagrams to solve problems. Sketch and interpret graphs. Write and interpret equations.
Lesson Flow
The first part of the unit begins with an exploration activity that focuses on a ratio as a way to compare the amount of egg and the amount of flour in a mixture. The context motivates a specific understanding of the use of, and need for, ratios as a way of making comparisons between quantities. Following this lesson, the usefulness of ratios in comparing quantities is developed in more detail, including a contrast to using subtraction to find differences. Students learn to interpret and express ratios as fractions, as decimal numbers, in a:b form, in words, and as data; they also learn to identify equivalent ratios.
The focus of the middle part of the unit is on the tools used to represent ratio relationships and on simplifying and comparing ratios. Students learn to use tape diagrams first, then double number lines, and finally ratio tables and graphs. As these tools are introduced, students use them in problem-solving contexts to solve ratio problems, including an investigation of glide ratios. Students are asked to make connections and distinctions among these forms of representation throughout these lessons. Students also choose a ratio project in this part of the unit (Lesson 8).
The third and last part of the unit covers understanding percents, including those greater than 100%.
Students have ample opportunities to check, deepen, and apply their understanding of ratios, including percents, with the selection of problems in the Gallery.
Students watch a video in which a double number line is used …
Students watch a video in which a double number line is used to solve a problem about getting the right amount of protein mix. Using the double number line is an example of modeling with mathematics, which is Mathematical Practice 4.Key ConceptsA double number line shows corresponding values for two variable quantities with a constant ratio between them. Each pair of tick marks that go together shows a ratio equivalent to all of the other ratios between corresponding tick marks.Goals and Learning ObjectivesWatch an example of students using mathematics to model a relationship between quantities (MP4).Use a double number line to solve a problem.Use a double number line to deepen understanding of equivalence in the context of a relationship between quantities with a constant ratio.SWD: Some students with disabilities will benefit from a preview of the goals in each lesson. Students can highlight the critical features and/or concepts and will help them to pay close attention to salient information.
No restrictions on your remixing, redistributing, or making derivative works. Give credit to the author, as required.
Your remixing, redistributing, or making derivatives works comes with some restrictions, including how it is shared.
Your redistributing comes with some restrictions. Do not remix or make derivative works.
Most restrictive license type. Prohibits most uses, sharing, and any changes.
Copyrighted materials, available under Fair Use and the TEACH Act for US-based educators, or other custom arrangements. Go to the resource provider to see their individual restrictions.