This subject is a computer-oriented introduction to probability and data analysis. It …
This subject is a computer-oriented introduction to probability and data analysis. It is designed to give students the knowledge and practical experience they need to interpret lab and field data. Basic probability concepts are introduced at the outset because they provide a systematic way to describe uncertainty. They form the basis for the analysis of quantitative data in science and engineering. The MATLAB® programming language is used to perform virtual experiments and to analyze real-world data sets, many downloaded from the web. Programming applications include display and assessment of data sets, investigation of hypotheses, and identification of possible casual relationships between variables. This is the first semester that two courses, Computing and Data Analysis for Environmental Applications (1.017) and Uncertainty in Engineering (1.010), are being jointly offered and taught as a single course.
This task introduces the fundamental statistical ideas of using data summaries (statistics) …
This task introduces the fundamental statistical ideas of using data summaries (statistics) from random samples to draw inferences (reasoned conclusions) about population characteristics (parameters). In the task built around an election poll scenario, the population is the entire seventh grade class, the unknown characteristic (parameter) of interest is the proportion of the class members voting for a specific candidate, and the sample summary (statistic) is the observed proportion of voters favoring the candidate in a random sample of class members.
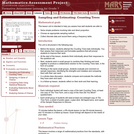
This lesson unit is intended to help you assess how well students …
This lesson unit is intended to help you assess how well students are able to: solve simple problems involving ratio and direct proportion; choose an appropriate sampling method; and collect discrete data and record them using a frequency table.
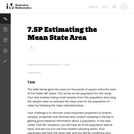
The task is designed to show that random samples produce distributions of …
The task is designed to show that random samples produce distributions of sample means that center at the population mean, and that the variation in the sample means will decrease noticeably as the sample size increases. Random sampling (like mixing names in a hat and drawing out a sample) is not a new idea to most students, although the terminology is likely to be new.
This course is an introduction to discrete applied mathematics. Topics include probability, …
This course is an introduction to discrete applied mathematics. Topics include probability, counting, linear programming, number-theoretic algorithms, sorting, data compression, and error-correcting codes. This is a Communication Intensive in the Major (CI-M) course, and thus includes a writing component.
For this task, Minitab software was used to generate 100 random samples …
For this task, Minitab software was used to generate 100 random samples of size 16 from a population where the probability of obtaining a success in one draw is 33.6% (Bernoulli). Given that multiple samples of the same size have been generated, students should note that there can be quite a bit of variability among the estimates from random samples and that on average, the center of the distribution of such estimates is at the actual population value and most of the estimates themselves tend to cluster around the actual population value.
The growing number of electronics that are becoming obsolete is staggering. The …
The growing number of electronics that are becoming obsolete is staggering. The responsible disposal of these materials remains to be a highly debated topic and is one that does not have an easy answer. In this problem-based learning module, students will research this growing issue and provide them opportunities to determine what actions to take. Students will then take their findings and use their research data as evidence to support their position. Groups will create a finished product in the form of a speech, radio broadcast, presentation or persuasive essay to help solve this problem.
No restrictions on your remixing, redistributing, or making derivative works. Give credit to the author, as required.
Your remixing, redistributing, or making derivatives works comes with some restrictions, including how it is shared.
Your redistributing comes with some restrictions. Do not remix or make derivative works.
Most restrictive license type. Prohibits most uses, sharing, and any changes.
Copyrighted materials, available under Fair Use and the TEACH Act for US-based educators, or other custom arrangements. Go to the resource provider to see their individual restrictions.