
Conditional Remix & Share Permitted
CC BY-SA

This learning module (Lesson 1 of Unit 5) is part of a course called Project Management Fundamentals and may either be completed individually as a stand-alone topic, or part of a trio of learning modules on time management, or as part of the course.
This course examines how randomization can be used to make algorithms simpler and more efficient via random sampling, random selection of witnesses, symmetry breaking, and Markov chains. Topics covered include: randomized computation; data structures (hash tables, skip lists); graph algorithms (minimum spanning trees, shortest paths, minimum cuts); geometric algorithms (convex hulls, linear programming in fixed or arbitrary dimension); approximate counting; parallel algorithms; online algorithms; derandomization techniques; and tools for probabilistic analysis of algorithms.
The three tasks in this set are not examples of tasks asking students to compute using the standard algorithms for multiplication and division because most people know what those kinds of problems look like. Instead, these tasks show what kinds of reasoning and estimation strategies students need to develop in order to support their algorithmic computations.
The three tasks (including part 1 and part 3) in this set are not examples of tasks asking students to compute using the standard algorithms for multiplication and division because most people know what those kinds of problems look like. Instead, these tasks show what kinds of reasoning and estimation strategies students need to develop in order to support their algorithmic computations.
6.780 covers statistical modeling and the control of semiconductor fabrication processes and plants. Topics covered include: design of experiments, response surface modeling, and process optimization; defect and parametric yield modeling; process/device/circuit yield optimization; monitoring, diagnosis, and feedback control of equipment and processes; and analysis and scheduling of semiconductor manufacturing operations.
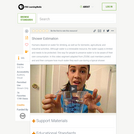
In this adapted ZOOM video segment, cast members calculate how much water they each use during a typical shower. They compare their results to their original predictions.
A general statistics course, which includes understanding data, measures of central tendency, measures of variation, binomial distributions, normal distributions, correlation and regression, probability and sampling distributions, Central Limit Theorem, confidence intervals, estimates of population parameters and hypothesis testing. Interpretation and data analysis are emphasized.
The major themes of this course are estimation and control of dynamic systems. Preliminary topics begin with reviews of probability and random variables. Next, classical and state-space descriptions of random processes and their propagation through linear systems are introduced, followed by frequency domain design of filters and compensators. From there, the Kalman filter is employed to estimate the states of dynamic systems. Concluding topics include conditions for stability of the filter equations.
This course examines the fundamentals of detection and estimation for signal processing, communications, and control. Topics covered include: vector spaces of random variables; Bayesian and Neyman-Pearson hypothesis testing; Bayesian and nonrandom parameter estimation; minimum-variance unbiased estimators and the Cramer-Rao bounds; representations for stochastic processes, shaping and whitening filters, and Karhunen-Loeve expansions; and detection and estimation from waveform observations. Advanced topics include: linear prediction and spectral estimation, and Wiener and Kalman filters.
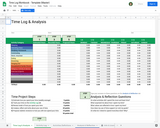
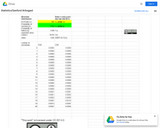
This Google Sheet was created to support a Time Management module in a Strategies for College Success course. The plan is for the instructor to share one copy of the Sheet with each student for an assignment lasting 2 or 3 weeks. Students estimate the time they spend each week on common daily tasks, such as sleeping, working, or attending class. Space is provided for students to enter up to three custom tasks. After estimating how they spend time, students track their time spent for a full week. Through the magic of spreadsheet formulas, time spent per task is color-coded to help visualize large and small blocks of time. Time for the week is tallied on the summary tab, where a warning message appears if less than 24 hours are logged for any given day. After comparing their estimated hours to their actual recorded hours, students propose changes they can make in how they spend their time to increase their scholastic success. A tab with five questions is included for student reflection. Instructions for how to use the Sheet are provided for faculty on the Info & LIcense tab. Cell formulas are editable only by the document owner; students cannot accidentally overwrite. Colors are selected from a palette known to be perceivable by people with most forms of colorblindness. Author contact information is available on the Info and License tab.
The course provides a survey of the theory and application of time series methods in econometrics. Topics covered will include univariate stationary and non-stationary models, vector autoregressions, frequency domain methods, models for estimation and inference in persistent time series, and structural breaks.
We will cover different methods of estimation and inferences of modern dynamic stochastic general equilibrium models (DSGE): simulated method of moments, Maximum likelihood and Bayesian approach. The empirical applications in the course will be drawn primarily from macroeconomics.
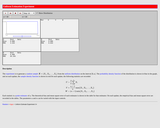
This resource consists of a Java applet and expository text. The applet simulates a random sample from the uniform distribution on the interval [0,a], and computes standard point estimates of a. The bias and mean square error are also computed.
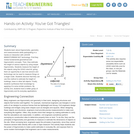
Students learn about trigonometry, geometry and measurements while participating in a hands-on interaction with LEGO® MINDSTORMS® NXT technology. First they review fundamental geometrical and trigonometric concepts. Then, they estimate the height of various objects by using simple trigonometry. Students measure the height of the objects using the LEGO robot kit, giving them an opportunity to see how sensors and technology can be used to measure things on a larger scale. Students discover that they can use this method to estimate the height of buildings, trees or other tall objects. Finally, students synthesize their knowledge by applying it to solve similar problems. By activity end, students have a better grasp of trigonometry and its everyday applications.