The National Center on Accessible Instructional Materials and PACER Center are pleased …
The National Center on Accessible Instructional Materials and PACER Center are pleased to announce the release of our new video explaining Accessible Instruc...
This is an overview of a dramatic play store/bakery center. It includes …
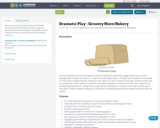
This is an overview of a dramatic play store/bakery center. It includes description, purpose, suggested materials, questioning examples, considerations, photo examples, literature connections and downloadable resources.
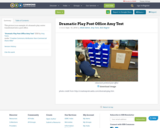
This resources provides information about setting up a doctor's office/ hospital dramatic …
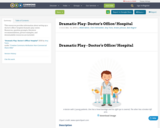
This resources provides information about setting up a doctor's office/ hospital dramatic play center. Resources, question prompts, literature recommendations, picture examples, and downloadable resources are included.
This is an overview of a dramatic play store/bakery center. It includes …
This is an overview of a dramatic play store/bakery center. It includes description, purpose, suggested materials, questioning examples, considerations, photo examples, literature connections and downloadable resources.
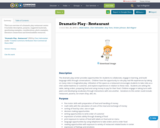
This is an overview of a dramatic play restaurant center. It includes …
This is an overview of a dramatic play restaurant center. It includes description, purpose, suggested materials, questioning examples, considerations, photo examples, literature connections and downloadable resources.
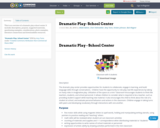
This is an overview of a dramatic play school center. It includes …
This is an overview of a dramatic play school center. It includes description, purpose, suggested materials, questioning examples, considerations, photo examples, literature connections and downloadable resources.
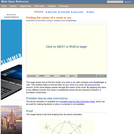
An interactive applet and associated web page that provide step-by-step instructions on …
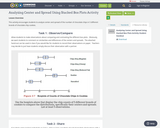
An interactive applet and associated web page that provide step-by-step instructions on how to find the center of a circle using only a compass and straightedge. The method used involves constructing the perpendicular bisectors of two random chords. The bisectors intersect at the center of the circle. The animation can be run either continuously like a video, or single stepped to allow classroom discussion and thought between steps. Applet can be enlarged to full screen size for use with a classroom projector. This resource is a component of the Math Open Reference Interactive Geometry textbook project at http://www.mathopenref.com.
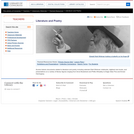
Access historic documents related to literature and poetry including selected Walt Whitman …
Access historic documents related to literature and poetry including selected Walt Whitman notebooks, digitized rare books, and presentations on a variety of literary figures ranging from Anne Bradstreet and Phillis Wheatley to Edgar Allan Poe and Ernest Hemingway.
Distributions and Variability Type of Unit: Project Prior Knowledge Students should be …
Distributions and Variability
Type of Unit: Project
Prior Knowledge
Students should be able to:
Represent and interpret data using a line plot. Understand other visual representations of data.
Lesson Flow
Students begin the unit by discussing what constitutes a statistical question. In order to answer statistical questions, data must be gathered in a consistent and accurate manner and then analyzed using appropriate tools.
Students learn different tools for analyzing data, including:
Measures of center: mean (average), median, mode Measures of spread: mean absolute deviation, lower and upper extremes, lower and upper quartile, interquartile range Visual representations: line plot, box plot, histogram
These tools are compared and contrasted to better understand the benefits and limitations of each. Analyzing different data sets using these tools will develop an understanding for which ones are the most appropriate to interpret the given data.
To demonstrate their understanding of the concepts, students will work on a project for the duration of the unit. The project will involve identifying an appropriate statistical question, collecting data, analyzing data, and presenting the results. It will serve as the final assessment.
Students will apply what they have learned in previous lessons to analyze …
Students will apply what they have learned in previous lessons to analyze and draw conclusions about a set of data. They will also justify their thinking based on what they know about the measures (e.g., I know the mean is a good number to use to describe what is typical because the range is narrow and so the MAD is low.).Students analyze one of the data sets about the characteristics of sixth grade students that was collected by the class in Lesson 2. Students construct line plots and calculate measures of center and spread in order to further their understanding of the characteristics of a typical sixth grade student.Key ConceptsNo new mathematical ideas are introduced in this lesson. Instead, students apply the skills they have acquired in previous lessons to analyze a data set for one attribute of a sixth grade student. Students make a line plot of the data and find the mean, median, range, MAD, and outliers. They use these results to determine a typical value for their data.Goals and Learning ObjectivesDescribe an attribute of a typical sixth grade student using line plots and measures of center (mean and median) and spread (range and MAD).Justify thinking about which measures are good descriptors of the data set.
In this lesson, students are given criteria about measures of center, and …
In this lesson, students are given criteria about measures of center, and they must create line plots for data that meet the criteria. Students also explore the effect on the median and the mean when values are added to a data set.Students use a tool that shows a line plot where measures of center are shown. Students manipulate the graph and observe how the measures are affected. Students explore how well each measure describes the data and discover that the mean is affected more by extreme values than the mode or median. The mathematical definitions for measures of center and spread are formalized.Key ConceptsStudents use the Line Plot with Stats interactive to develop a greater understanding of the measures of center. Here are a few of the things students may discover:The mean and the median do not have to be data points.The mean is affected by extreme values, while the median is not.Adding values above the mean increases the mean. Adding values below the mean decreases the mean.You can add values above and below the mean without changing the mean, as long as those points are “balanced.”Adding values above the median may or may not increase the median. Adding values below the median may or may not decrease the median.Adding equal numbers of points above and below the median does not change the median.The measures of center can be related in any number of ways. For example, the mean can be greater than the median, the median can be greater than the mean, and the mode can be greater than or less than either of these measures.Note: In other courses, students will learn that a set of data may have more than one mode. That will not be the case in this lesson.Goals and Learning ObjectivesExplore how changing the data in a line plot affects the measures of center (mean, median).Understand that the mean is affected by outliers more than the median is.Create line plots that fit criteria for given measures of center.
This math center overview provides a description, purpose, suggested materials, questioning suggestions, …
This math center overview provides a description, purpose, suggested materials, questioning suggestions, considerations, photo examples and literature selections.
This course explores how social theories of urban life can be related …
This course explores how social theories of urban life can be related to the city's architecture and spaces. It is grounded in classic or foundational writings about the city addressing such topics as the public realm and public space, impersonality, crowds and density, surveillance and civility, imprinting time on space, spatial justice, and the segregation of difference. The aim of the course is to generate new ideas about the city by connecting the social and the physical, using Boston as a visual laboratory. Students are required to present a term paper mediating what is read with what has been observed.
No restrictions on your remixing, redistributing, or making derivative works. Give credit to the author, as required.
Your remixing, redistributing, or making derivatives works comes with some restrictions, including how it is shared.
Your redistributing comes with some restrictions. Do not remix or make derivative works.
Most restrictive license type. Prohibits most uses, sharing, and any changes.
Copyrighted materials, available under Fair Use and the TEACH Act for US-based educators, or other custom arrangements. Go to the resource provider to see their individual restrictions.