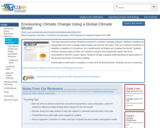
This interactive addresses the question if we can reduce CO2 emissions by …
This interactive addresses the question if we can reduce CO2 emissions by 20% of 1990 levels and help avoid dangerous climate change? Users of this interactive can manipulate changes to various sources and uses (supply and demand) of energy with the goal of reducing C02 emissions in Great Britain by 80% in the year 2050.
This activity introduces students to different forms of energy, energy transformations, energy …
This activity introduces students to different forms of energy, energy transformations, energy storage, and the flow of energy through systems. Students learn that most energy can be traced back to nuclear fusion on the sun.
This online calculator converts from one energy unit to another - from …
This online calculator converts from one energy unit to another - from gallons to British thermal units (Btu), kilowatt/hours to megajoules, short tons to metric tons.
This video segment describes climate data collection from Greenland ice cores that …
This video segment describes climate data collection from Greenland ice cores that indicate Earth's climate can change abruptly over a single decade rather than over thousands of years. The narrator describes how Earth has undergone dramatic climate shifts in relatively short spans of time prior to 8000 years ago. The video and accompanying essay provide explanations of the differences between weather and climate and how the climate itself had been unstable in the past, with wide variations in temperature occurring over decadal timescales.
This video succinctly explains the mechanism of the natural greenhouse effect and …
This video succinctly explains the mechanism of the natural greenhouse effect and the cause of global climate change (anthropogenic global warming). It is short, basic, and to the point. It's also available in 12 languages!
This long classroom activity introduces students to a climate modeling software. Students …
This long classroom activity introduces students to a climate modeling software. Students visualize how temperature and snow coverage might change over the next 100 years. They run a 'climate simulation' to establish a baseline for comparison, do a 'experimental' simulation and compare the results. Students will then choose a region of their own interest to explore and compare the results with those documented in the IPCC impact reports. Students will gain a greater understanding and appreciation of the process and power of climate modeling.
This activity engages learners to investigate the impact of Earth's tilt and …
This activity engages learners to investigate the impact of Earth's tilt and the angle of solar insolation as the reason for seasons by doing a series of hands-on activities that include scale models. Students plot the path of the Sun's apparent movement across the sky on two days separated by three months of time.
This Earth Exploration Toolbook chapter is a detailed computer-based exploration in which …
This Earth Exploration Toolbook chapter is a detailed computer-based exploration in which students learn how various climatic conditions impact the formations of sediment layers on the ocean floor. They analyze sediment core data from the Ross Ice Shelf in Antarctica for evidence of climate changes over time. In addition, they interact with various tools and animations throughout the activity, in particular the Paleontological Stratigraphic Interval Construction and Analysis Tool (PSICAT) that is used to construct a climate change model of a sediment core from core images.
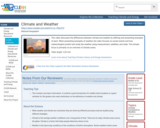
This video discusses the differences between climate and weather by defining and …
This video discusses the differences between climate and weather by defining and presenting examples of each. When presenting examples of weather, the video focuses on severe events and how meteorologists predict and study the weather using measurement, satellites, and radar. The climate focus is primarily on an overview of climate zones.
This video, from the US Department of Energy, shows the basics of …
This video, from the US Department of Energy, shows the basics of how a PV panel converts light radiated from the sun into usable power, whether on the electric grid or off, and without emissions or the use of fossil fuels.
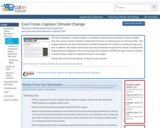
This video and accompanying essay examine ways to reduce the environmental impact …
This video and accompanying essay examine ways to reduce the environmental impact of burning coal. Two technologies are discussed: turning solid coal into a clean-burning fuel gas (syngas), and capture and storage of CO2.
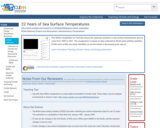
This NOAA visualization on YouTube shows the seasonal variations in sea surface …
This NOAA visualization on YouTube shows the seasonal variations in sea surface temperatures and ice cover from 1985 to 2007. The visualization is based on data collected by NOAA polar-orbiting satellites. El NiÃo and La NiÃa are easily identified, as are the trends in decreasing polar sea ice.
This simulation provides scenarios for exploring the principles of climate dynamics from …
This simulation provides scenarios for exploring the principles of climate dynamics from a multi-disciplinary perspective. Interconnections among climate issues, public stakeholders, and the governance spheres are investigated through creative simulations designed to help students understand international climate change negotiations.
(Copyrighted by Climate Interactive, creators of the Climate Scoreboard, C-ROADS, Climate Bathtub and other interactive tools to enable thinking in systems)
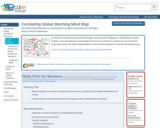
An attractive concept/mind map that illustrates various human strategies for responding to …
An attractive concept/mind map that illustrates various human strategies for responding to climate change. It was developed by a psychologist and not by an educator or scientist but can be used to inspire discussion and artistic representations of the human dimension to climate and energy issues.
In this activity, students learn about how climate change is affecting the …
In this activity, students learn about how climate change is affecting the Arctic ecosystem and then investigate how this change is impacting polar bear populations. Students analyze maps of Arctic sea ice, temperature graphs, and polar bear population data to answer questions about the impact of climate change on the Arctic ecosystem.
Video introduces wind energy research at the National Renewable Energy Lab (NREL) …
Video introduces wind energy research at the National Renewable Energy Lab (NREL) and provides an overview of the NREL Wind Technology Center near Boulder, Colorado.
In this activity, students chart temperature changes over time in Antarctica's paleoclimate …
In this activity, students chart temperature changes over time in Antarctica's paleoclimate history by reading rock cores. Students use their data to create an interactive display illustrating how Antarctica's climate timeline can be interpreted from ANDRILL rock cores.
This teaching activity is an introduction to how ice cores from the …
This teaching activity is an introduction to how ice cores from the cryosphere are used as indicators and record-keepers of climate change as well as how climate change will affect the cryosphere.
In this video, a team of paleontologists, paleobotanists, soil scientists, and other …
In this video, a team of paleontologists, paleobotanists, soil scientists, and other researchers take to the field in Wyoming's Bighorn Basin to document how the climate, plants, and animals there changed during the Paleocene- Eocene Thermal Maximum (PETM). During this time a sudden, enormous influx of carbon flooded the ocean and atmosphere for reasons that are still unclear to scientists. The PETM is used as an analog to the current warming. The scientists' research may help inform our understanding of current increases in carbon in the atmosphere and ocean and the resulting impact on ecosystems.
In this video, students learn that scientific evidence strongly suggests that different …
In this video, students learn that scientific evidence strongly suggests that different regions on Earth do not respond equally to increased temperatures. Ice-covered regions appear to be particularly sensitive to even small changes in global temperature. This video segment adapted from NASA's Goddard Space Flight Center details how global warming may already be responsible for a significant reduction in glacial ice, which may in turn have significant consequences for the planet.
No restrictions on your remixing, redistributing, or making derivative works. Give credit to the author, as required.
Your remixing, redistributing, or making derivatives works comes with some restrictions, including how it is shared.
Your redistributing comes with some restrictions. Do not remix or make derivative works.
Most restrictive license type. Prohibits most uses, sharing, and any changes.
Copyrighted materials, available under Fair Use and the TEACH Act for US-based educators, or other custom arrangements. Go to the resource provider to see their individual restrictions.