A series of 6 Excel-based projects on the mathematics of biodiversity for …
A series of 6 Excel-based projects on the mathematics of biodiversity for basic college math classes and developmental math classes. Students learn about the structure of biodiversity, the application of many basic data analysis skills, and the use of Excel for analysis and data presentation.
Living Atlas Indicators of the Planet provide the user with up-to-date data, …
Living Atlas Indicators of the Planet provide the user with up-to-date data, maps, graphs, charts, animation and other visuals to explore the science of climate and environmental change. 18 indicators from Air Quality to Women in Parliament can be explored.
This lesson sequence guides students to learn about the geography and the …
This lesson sequence guides students to learn about the geography and the unique characteristics of the Arctic, including vegetation, and people who live there. Students use Google Earth to explore the Arctic and learn about meteorological observations in the Arctic, including collecting their own data in hands-on experiments. This is the first part of a three-part curriculum about Arctic climate.
In this jigsaw activity, students explore meteorological data collected from Eureka, Canada …
In this jigsaw activity, students explore meteorological data collected from Eureka, Canada to try to decide when would be the best time for an Arctic visit.
In this activity, students use authentic Arctic climate data to unravel some …
In this activity, students use authentic Arctic climate data to unravel some causes and effects related to the seasonal melting of the snowpack and to further understand albedo.
This video uses film of the Arctic and Arctic researchers as well …
This video uses film of the Arctic and Arctic researchers as well as animations to discuss feedbacks in the Arctic climate system related to sea ice, the ocean, and clouds. It explains concepts such as albedo and positive and negative feedbacks. The narrative includes discussion of current research and a summary which explains why understanding feedbacks is important.
In this audio slideshow, an ecologist from the University of Florida describes …
In this audio slideshow, an ecologist from the University of Florida describes the radiocarbon dating technique that scientists use to determine the amount of carbon within the permafrost of the Arctic tundra. Understanding the rate of carbon released as permafrost thaws is necessary to understand how this positive feedback mechanism is contributing to climate change that may further increase global surface temperatures.
In this short video, host Dr. Ryan interviews graduate student Amy Steiker …
In this short video, host Dr. Ryan interviews graduate student Amy Steiker at the Institute of Arctic and Alpine Research about her research, using isotopes of nitrous oxide, connecting human activity to greenhouse gas emissions.
A lab activity evaluating the hypothesis that Earth's biosphere is currently undergoing …
A lab activity evaluating the hypothesis that Earth's biosphere is currently undergoing a mass extinction, the so-called "sixth extinction." Students practice quantitative skills by calculating extinction percentages and rates in recent history using real-world data from the work of Ceballos et al. (2015). Then, they integrate modern and fossil data to see whether recent extinctions more closely resemble a mass extinction or the background rate of extinction in the fossil record. In the process, students critically examine sources of error and uncertainty and reflect on how to resolve them.
This article and slide show from the New York Times, features several …
This article and slide show from the New York Times, features several scientists from the University of Alaska, Fairbanks, who study the effects of thawing permafrost in Alaska.
In this laboratory exercise students will have an opportunity to examine the …
In this laboratory exercise students will have an opportunity to examine the crystal structures, optical properties and health hazards of the common asbestos minerals. The laboratory will reinforce optical microscopic skills that students have learned in mineralogy and show them how mineralogy can be critical to understanding a current public policy issue.
(Note: this resource was added to OER Commons as part of a batch upload of over 2,200 records. If you notice an issue with the quality of the metadata, please let us know by using the 'report' button and we will flag it for consideration.)
Using Landsat 8 imagery from before and after the 2015 wildfire season …
Using Landsat 8 imagery from before and after the 2015 wildfire season in Glacier National Park, Montana, learners calculate the damage using a Normalized Burn Index, digitize the burn area, and publish to ArcGIS Online.
This easy-to-understand video animation describes drought and explains the different categories of …
This easy-to-understand video animation describes drought and explains the different categories of drought used by the drought monitor. It discusses the effects of and contributions to drought, what the implications of the different drought levels are, and puts the drought maps into context to understand how the impacts vary geographically (e.g. drought in Nevada vs Kansas - one could affect tourism, the other agriculture). It also touches on how the development of maps/drought severity is determined and how it might vary geographically. The animation provides a basic overview of statistics and percentiles and the concept of '100 year events.'
Students will read primary scientific literature, work collaboratively, think critically, and utilize …
Students will read primary scientific literature, work collaboratively, think critically, and utilize GIS as a tool to visualize and quantify spatial and temporal changes in hydrological systems.
(Note: this resource was added to OER Commons as part of a batch upload of over 2,200 records. If you notice an issue with the quality of the metadata, please let us know by using the 'report' button and we will flag it for consideration.)
This module introduces students who are already familiar with GIS to doing …
This module introduces students who are already familiar with GIS to doing comparative analyses with large-scale community science (often called citizen science) data sets. Students will explore how we can use community science data to examine the spread and distribution of invasive species in different geographic locations. In the final step, students will identify different invasive species and determine if community science data accurately maps the threat these species pose.
(Note: this resource was added to OER Commons as part of a batch upload of over 2,200 records. If you notice an issue with the quality of the metadata, please let us know by using the 'report' button and we will flag it for consideration.)
Given that humans historically have heavily used rivers and the lands along …
Given that humans historically have heavily used rivers and the lands along them for agriculture, transportation and other activities, how does human impact currently affect riparian ecosystems in a rural region? Students will address this question through several activities.
(Note: this resource was added to OER Commons as part of a batch upload of over 2,200 records. If you notice an issue with the quality of the metadata, please let us know by using the 'report' button and we will flag it for consideration.)
In this activity, students explore the web-based U.S. Forest Service Climate Change …
In this activity, students explore the web-based U.S. Forest Service Climate Change Atlas to learn about projected climate changes in their state and how suitable habitat for tree and bird species is projected to change by 2100.
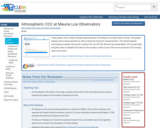
These graphs show carbon dioxide measurements at the Mauna Loa Observatory, Hawaii. …
These graphs show carbon dioxide measurements at the Mauna Loa Observatory, Hawaii. The graphs display recent measurements as well as historical long term measurements. The related website summarizes in graphs the recent monthly CO2, the full CO2 Record, the annual Mean CO2 Growth Rate, and gives links to detailed CO2 data for this location, which is one of the most important CO2 tracking sites in the world.
No restrictions on your remixing, redistributing, or making derivative works. Give credit to the author, as required.
Your remixing, redistributing, or making derivatives works comes with some restrictions, including how it is shared.
Your redistributing comes with some restrictions. Do not remix or make derivative works.
Most restrictive license type. Prohibits most uses, sharing, and any changes.
Copyrighted materials, available under Fair Use and the TEACH Act for US-based educators, or other custom arrangements. Go to the resource provider to see their individual restrictions.