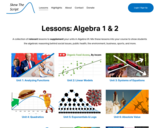
A collection of relevant lessons to supplement your units in Algebra I/II. …
A collection of relevant lessons to supplement your units in Algebra I/II. Mix these lessons into your course to show students the algebraic reasoning behind social issues, public health, the environment, business, sports, and more.
Learn about graphing polynomials. The shape of the curve changes as the …
Learn about graphing polynomials. The shape of the curve changes as the constants are adjusted. View the curves for the individual terms (e.g. y=bx ) to see how they add to generate the polynomial curve.
This lesson unit is intended to help teachers assess how well students …
This lesson unit is intended to help teachers assess how well students are able to understand what the different algebraic forms of a quadratic function reveal about the properties of its graphical representation. In particular, the lesson will help teachers identify and help students who have the following difficulties: understanding how the factored form of the function can identify a graphŐs roots; understanding how the completed square form of the function can identify a graphŐs maximum or minimum point; and understanding how the standard form of the function can identify a graphŐs intercept.
This lesson unit is intended to help teachers assess how well students …
This lesson unit is intended to help teachers assess how well students are able to: articulate verbally the relationships between variables arising in everyday contexts; translate between everyday situations and sketch graphs of relationships between variables; interpret algebraic functions in terms of the contexts in which they arise; and reflect on the domains of everyday functions and in particular whether they should be discrete or continuous.
This is the first unit in the Algebra II curriculum and is …
This is the first unit in the Algebra II curriculum and is fundamental for the rest of the year. During this course students study many different functions and their key features. Students will compare, contrast, and make generalizations about these functions using the key features and proper notation. This unit ensures that students can identify each type of key feature properly throughout the rest of the year.Objectives: Students will express and interpret intervals using both interval and inequality notation.Students will be able to express the domain and range of graphs using both interval and inequality notation.Students will be able to find the x and y intercepts of a function from a graph or from a linear equation.Students will be able to identify extrema, increasing, decreasing and constant intervals of a graph using interval notation.Students will be able to write the end behavior for any given graph.Technology Utilized: ● Desmos - This is an online graphing tool that can be used to make basic graphs as well as premade teacher bundles with student investigations. In this unit I have taken some of the premade investigations and edited them to meet my classroom needs.● Answer Garden - This tool will be used to brainstorm key features at the beginning of the unit and to assess student’s prior knowledge.● Kahoot - This tool is used as a classroom formative assessment. Students must be all on the same question which can also elicit discussion and show misconceptions with instant feedback.● Google Forms - This tool is used for short assessments, exit tickets, and graded homework assignments. The ability for multiple types of questions and self checking quiz option make this an easy way to quickly assess students and give feedback.
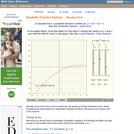
Students determine the refractive index of a liquid with a simple technique …
Students determine the refractive index of a liquid with a simple technique using a semi-circular hollow block. Then they predict the refractive index of a material (a Pyrex glass tube) by matching it with the known refractive index of a liquid using the percent light transmission measurement. The homemade light intensity detector uses an LED and multimeter, which are relatively inexpensive (and readily available) compared to commercially available measurement instruments.
An interactive applet that allows the user to graphically explore the properties …
An interactive applet that allows the user to graphically explore the properties of a quadratic equation. Specifically, it is designed to foster an intuitive understanding of the effects of changing the three coefficients in the function. The applet shows a large graph of a quadratic (ax^2 + bx +c) and has three slider controls, one each for the coefficients a,b and c. As the sliders are moved, the graph is redrawn in real time illustrating the effects of these variations. The roots of the equation are shown both graphically and numerically, including the case where the roots are imaginary. Applet can be enlarged to full screen size for use with a classroom projector. This resource is a component of the Math Open Reference Interactive Geometry textbook project at http://www.mathopenref.com.
This lesson unit is intended to help teachers assess how well students …
This lesson unit is intended to help teachers assess how well students are able to translate between graphs and algebraic representations of polynomials. In particular, this unit aims to help you identify and assist students who have difficulties in: recognizing the connection between the zeros of polynomials when suitable factorizations are available, and graphs of the functions defined by polynomials; and recognizing the connection between transformations of the graphs and transformations of the functions obtained by replacing f(x) by f(x + k), f(x) + k, -f(x), f(-x).
Students are introduced to various types of energy with a focus on …
Students are introduced to various types of energy with a focus on thermal energy and types of heat transfer as they are challenged to design a better travel thermos that is cost efficient, aesthetically pleasing and meets the design objective of keeping liquids hot. They base their design decisions on material properties such thermal conductivity, cost and function. These engineering and science concepts are paired with student experiences to build an understanding of heat transfer as it plays a role in their day-to-day lives. While this introduction only shows the top-level concepts surrounding the mathematics associated with heat transfer; the skills become immediately useful as students apply what they know to solve an engineering challenge.
No restrictions on your remixing, redistributing, or making derivative works. Give credit to the author, as required.
Your remixing, redistributing, or making derivatives works comes with some restrictions, including how it is shared.
Your redistributing comes with some restrictions. Do not remix or make derivative works.
Most restrictive license type. Prohibits most uses, sharing, and any changes.
Copyrighted materials, available under Fair Use and the TEACH Act for US-based educators, or other custom arrangements. Go to the resource provider to see their individual restrictions.