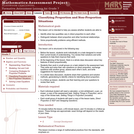
Students discuss classroom routines and expectations, work with partners to present their …
Students discuss classroom routines and expectations, work with partners to present their work matching different representations of a ratio situation, and then prepare math summaries.Introduce classroom routines and expectations prior to the full mathematics lesson. Ask students to discuss how to clearly present their work to their classmates. Model an example of partner work, and then have students work with their partners to match different representations of a ratio situation. Read and discuss a Summary of the Math, and then have students write Reflections about their wonderings.Key ConceptsStudents match a data card with its corresponding ratio, decimal, fraction, percent, and description of the relationship in words. Students construct viable arguments for their matches and critique the reasoning of their partner and other classmates.Goals and Learning ObjectivesDescribe the classroom routines and expectations.Consider how to present work clearly to classmates.Collaborate with a partner.Critique a partner’s reasoning.Connect different representations of a ratio situation.
Proportional Relationships Type of Unit: Concept Prior Knowledge Students should be able …
Proportional Relationships
Type of Unit: Concept
Prior Knowledge
Students should be able to:
Understand what a rate and ratio are. Make a ratio table. Make a graph using values from a ratio table.
Lesson Flow
Students start the unit by predicting what will happen in certain situations. They intuitively discover they can predict the situations that are proportional and might have a hard time predicting the ones that are not. In Lessons 2–4, students use the same three situations to explore proportional relationships. Two of the relationships are proportional and one is not. They look at these situations in tables, equations, and graphs. After Lesson 4, students realize a proportional relationship is represented on a graph as a straight line that passes through the origin. In Lesson 5, they look at straight lines that do not represent a proportional relationship. Lesson 6 focuses on the idea of how a proportion that they solved in sixth grade relates to a proportional relationship. They follow that by looking at rates expressed as fractions, finding the unit rate (the constant of proportionality), and then using the constant of proportionality to solve a problem. In Lesson 8, students fine-tune their definition of proportional relationship by looking at situations and determining if they represent proportional relationships and justifying their reasoning. They then apply what they have learned to a situation about flags and stars and extend that thinking to comparing two prices—examining the equations and the graphs. The Putting It Together lesson has them solve two problems and then critique other student work.
Gallery 1 provides students with additional proportional relationship problems.
The second part of the unit works with percents. First, percents are tied to proportional relationships, and then students examine percent situations as formulas, graphs, and tables. They then move to a new context—salary increase—and see the similarities with sales taxes. Next, students explore percent decrease, and then they analyze inaccurate statements involving percents, explaining why the statements are incorrect. Students end this sequence of lessons with a formative assessment that focuses on percent increase and percent decrease and ties it to decimals.
Students have ample opportunities to check, deepen, and apply their understanding of proportional relationships, including percents, with the selection of problems in Gallery 2.
Students analyze the graph of a proportional relationship in order to find …
Students analyze the graph of a proportional relationship in order to find the approximate constant of proportionality, to write the related formula, and to create a table of values that lie on the graph.Key ConceptsThe constant of proportionality determines the steepness of the straight-line graph that represents a proportional relationship. The steeper the line is, the greater the constant of proportionality.On the graph of a proportional relationship, the constant of proportionality is the constant ratio of y to x, or the slope of the line.A proportional relationship can be represented in different ways: a ratio table, a graph of a straight line through the origin, or an equation of the form y = kx, where k is the constant of proportionality.Goals and Learning ObjectivesIdentify the constant of proportionality from a graph that represents a proportional relationship.Write a formula for a graph that represents a proportional relationship.Make a table for a graph that represents a proportional relationship.Relate the constant of proportionality to the steepness of a graph that represents a proportional relationship (i.e., the steeper the line is, the greater the constant of proportionality).
Students connect percent to proportional relationships in the context of sales tax.Key …
Students connect percent to proportional relationships in the context of sales tax.Key ConceptsWhen there is a constant tax percent, the total cost for items purchase—including the price and the tax—is proportional to the price.To find the cost, c , multiply the price of the item, p, by (1 + t), where t is the tax percent, written as a decimal: c = p(1 + t).The constant of proportionality is (1 + t) because of the structure of the situation:c = p + tp = p(1 + t).Because of the distributive property, multiplying the price by (1 + t) means multiplying the price by 1, then multiplying the price by t, and then taking the sum of these products.Goals and Learning ObjectivesFind the total cost in a sales tax situation.Understand that a proportional relationship only exists between the price of an item and the total cost of the item if the sales tax is constant.Find the constant of proportionality in a sales tax situation.Make a graph of an equation showing the relationship between the price of an item and the total amount paid.
Lesson OverviewStudents calculate the constant of proportionality for a proportional relationship based …
Lesson OverviewStudents calculate the constant of proportionality for a proportional relationship based on a table of values and use it to write a formula that represents the proportional relationship.Key ConceptsIf two quantities are proportional to one another, the relationship between them can be defined by a formula of the form y = kx, where k is the constant ratio of y-values to corresponding x-values. The same relationship can also be defined by the formula x=(1k)y , where 1k is now the constant ratio of x-values to y-values.Goals and Learning ObjectivesDefine the constant of proportionality.Calculate the constant of proportionality from a table of values.Write a formula using the constant of proportionality.
Students are asked whether they can determine the number of books in …
Students are asked whether they can determine the number of books in a stack by measuring the height of the stack, or the number of marbles in a collection of marbles by weighing the collection.Students are asked to identify for which situations they can determine the number of books in a stack of books by measuring the height of the stack or the number of marbles in a collection of marbles by weighing the collection.Key ConceptsAs students examine different numerical relationships, they come to understand that they can find the number of books or the number of marbles in situations in which the books are all the same thickness and the marbles are all the same weight. This “constant” is equal to the value BA for a ratio A : B; students begin to develop an intuitive understanding of proportional relationships.Goals and Learning ObjectivesExplore numerical relationshipsSWD: Some students with disabilities will benefit from a preview of the goals in each lesson. Have students highlight the critical features or concepts to help them pay close attention to salient information.
Students write the relationship between two fractions as a unit rate and …
Students write the relationship between two fractions as a unit rate and use unit rates and the constant of proportionality to solve problems involving proportional relationships.Key ConceptsIn situations where there is a constant rate involved, the unit rate is a constant of proportionality between the two variable quantities and can be used to write a formula of the form y = kx.A given constant rate can be simplified to find the unit rate by expressing its value with a denominator of 1.The ratios of two fractions can be expressed as a unit rate.Goals and Learning ObjectivesExpress the ratios of two fractions as a unit rate.Understand that when a constant rate is involved, the unit rate is the constant of proportionality.Use the unit rate to write and solve a formula of the form y = kx.
Students look at the relationship between the number of flags manufactured and …
Students look at the relationship between the number of flags manufactured and the stars on the flag and determine whether it represents a proportional relationship.Key ConceptsThe form of the equation of a proportional relation is y = kx, where k is the constant of proportionality.A graph of a proportional relationship is a straight line that passes through the origin.The constant of a proportionality in a graph of a proportional relationship is the constant ratio of y to x (the slope of the line).Goals and Learning ObjectivesIdentify the constant of proportionality in a proportional relationship based on a real-world problem situation.Write a formula using the constant of proportionality.Analyze a graph of a proportional relationship.Make a graph and determine if it represents a proportional relationship.Identify the constant of proportionality in a graph of a proportional relationship.
Students explore the idea that not all straight lines are proportional by …
Students explore the idea that not all straight lines are proportional by comparing a graph representing a stack of books with a graph representing a stack of cups. They recognize that all proportional relationships are represented as a straight line that passes through the origin.Key ConceptsNot all graphs of straight lines represent proportional relationships.There are three ways to tell whether a relationship between two varying quantities is proportional:The graph of the relationship between the quantities is a straight line that passes through the point (0, 0).You can express one quantity in terms of the other using a formula of the form y = kx.The ratios between the varying quantities are constant.Goals and Learning ObjectivesUnderstand when a graph of a straight line is and when it is not a proportional relationship.Recognize that a proportional relationship is shown on a graph as a straight line that passes through the origin (0, 0).Make a table of values to represent two quantities that vary.Graph a table of values representing two quantities that vary.Describe what each variable and number in a formula represents.
Students determine whether a relationship between two quantities that vary is a …
Students determine whether a relationship between two quantities that vary is a proportional relationship in three different situations: the relationship between the dimensions of the actual Empire State Building and a miniature model of the building; the relationship between the distance and time to travel to an amusement park; and the relationship between time and temperature at an amusement park.Key ConceptsWhen the ratio between two varying quantities remains constant, the relationship between the two quantities is called a proportional relationship. For a ratio A:B, the proportional relationship can be described as the collection of ratios equivalent to A:B, or cA:cB, where c is positive.Goals and Learning ObjectivesIdentify proportional relationships.Explain why a situation represents a proportional relationship or why it does not.Determine missing values in a table of quantities based on a proportional relationship.
Students interpret verbal descriptions of situations and determine whether the situations represent …
Students interpret verbal descriptions of situations and determine whether the situations represent proportional relationships.Key ConceptsIn a proportional relationship, there has to be some value that is constant.There are some relationships in some situations that can never be proportional.Goals and Learning ObjectivesIdentify verbal descriptions of situations as being proportional relationships or notUnderstand that some relationships can never be proportionalUnderstand that for two variable quantities to be proportional to one another, something in the situation has to be constant
Students continue to explore the three relationships from the previous lessons: Comparing …
Students continue to explore the three relationships from the previous lessons: Comparing Dimensions, Driving to the Amusement Park, and Temperatures at the Amusement Park. They graph the three situations and realize that the two proportional relationships form a straight line, but the time and temperature relationship does not.Key ConceptsA table of values that represent equivalent ratios can be graphed in the coordinate plane. The graph represents a proportional relationship in the form of a straight line that passes through the origin (0, 0). The unit rate is the slope of the line.Goals and Learning ObjectivesRepresent relationships shown in a table of values as a graph.Recognize that a proportional relationship is shown on a graph as a straight line that passes through the origin (0, 0).
Students have an opportunity to review their own work on the Self …
Students have an opportunity to review their own work on the Self Check in the previous lesson, consider feedback that addresses specific aspects of their work, examine a different approach to the problem from the Self Check, and then use what they learned to solve a closely related problem.Key ConceptsStudents reflect on their work, review and critique student work on the same problem, and then apply their learning to solve a similar problem.Goals and Learning ObjectivesUse teacher comments to refine their solution strategies for a proportional relationship problemDeepen their understanding of proportional relationships.Synthesize and connect strategies for representing and investigating proportional relationships.Critique given student work involving proportional relationships.Apply deepened understanding of proportional relationships to a new problem situation.
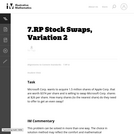
Students watch a video showing three different ways to solve a problem …
Students watch a video showing three different ways to solve a problem involving a proportional relationship, and then they use each method to solve a similar problem. Students describe each approach, including the mathematical terms associated with each.Key ConceptsThree methods for solving problems involving proportional relationships include:Setting up a proportion and solving for the missing valueFinding the unit rate and multiplyingWriting and solving a formula using the constant of proportionalityGoals and Learning ObjectivesSolve a problem involving a proportional relationship in three different ways: set up a proportion and solve for a missing value, use a unit rate, and use the constant of proportionality to write and solve a formula.
This lesson unit is intended to help teachers assess whether students are …
This lesson unit is intended to help teachers assess whether students are able to: identify when two quantities vary in direct proportion to each other; distinguish between direct proportion and other functional relationships; and solve proportionality problems using efficient methods.
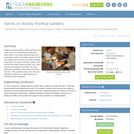
Students explore whether rooftop gardens are a viable option for combating the …
Students explore whether rooftop gardens are a viable option for combating the urban heat island effect. Can rooftop gardens reduce the temperature inside and outside houses? Teams each design and construct two model buildings using foam core board, one with a "green roof" and the other with a black tar paper roof. They measure and graph the ambient and inside building temperatures while under heat lamps and fans. Then students analyze the data and determine whether the rooftop gardens are beneficial to the inhabitants.
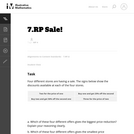
The purpose of this task is to engage students in Standard for …
The purpose of this task is to engage students in Standard for Mathematical Practice 4, Model with mathematics and as such, the question as it is worded cannot be answered without making some assumptions. For example, if the items that are purchased do not have the same value, then the price reduction depends on the cost of the items.
Students will analyze ratios and use proportions to solve problems using a …
Students will analyze ratios and use proportions to solve problems using a cooperative, kinesthetic activity in which they will create “human ratios.” Students will apply proportional reasoning to demonstrate application of a multiplicative situation by using cross products to solving proportions.
No restrictions on your remixing, redistributing, or making derivative works. Give credit to the author, as required.
Your remixing, redistributing, or making derivatives works comes with some restrictions, including how it is shared.
Your redistributing comes with some restrictions. Do not remix or make derivative works.
Most restrictive license type. Prohibits most uses, sharing, and any changes.
Copyrighted materials, available under Fair Use and the TEACH Act for US-based educators, or other custom arrangements. Go to the resource provider to see their individual restrictions.