Students work in a whole-class setting, independently, and with partners to design …
Students work in a whole-class setting, independently, and with partners to design and implement a problem-solving plan based on the mathematical concepts of rates and multiple representations (e.g., tables, equations, and graphs). They analyze a rule of thumb and use this relationship to calculate the distance in miles from a viewer's vantage point to lightning.Key ConceptsThroughout this unit, students are encouraged to apply the mathematical concepts they have learned over the course of this year to new settings. Help students develop and refine these problem-solving skills:Creating a problem-solving plan and implementing the plan systematicallyPersevering through challenging problems to find solutionsRecalling prior knowledge and applying that knowledge to new situationsMaking connections between previous learning and real-world problemsCommunicating their approaches with precision and articulating why their strategies and solutions are reasonableCreating efficacy and confidence in solving challenging problems in the real worldGoals and Learning ObjectivesCreate and implement a problem-solving plan.Organize and interpret data presented in a problem situation.Analyze the relationship between two variables.Create a rate table to organize data and make predictions.Apply the relationship between the variables to write a mathematical formula and use the formula to solve problems.Create a graph to display proportional relationships, and use this graph to make predictions.Articulate strategies, thought processes, and approaches to solving a problem, and defend why the solution is reasonable.
Rate Type of Unit: Concept Prior Knowledge Students should be able to: …
Rate
Type of Unit: Concept
Prior Knowledge
Students should be able to:
Solve problems involving all four operations with rational numbers. Understand quantity as a number used with a unit of measurement. Solve problems involving quantities such as distances, intervals of time, liquid volumes, masses of objects, and money, and with the units of measurement for these quantities. Understand that a ratio is a comparison of two quantities. Write ratios for problem situations. Make and interpret tables, graphs, and diagrams. Write and solve equations to represent problem situations.
Lesson Flow
In this unit, students will explore the concept of rate in a variety of contexts: beats per minute, unit prices, fuel efficiency of a car, population density, speed, and conversion factors. Students will write and refine their own definition for rate and then use it to recognize rates in different situations. Students will learn that every rate is paired with an inverse rate that is a measure of the same relationship. Students will figure out the logic of how units are used with rates. Then students will represent quantitative relationships involving rates, using tables, graphs, double number lines, and formulas, and they will see how to create one such representation when given another.
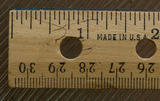
In this lesson, students use a ruler that measures both inches and …
In this lesson, students use a ruler that measures both inches and centimeters to find conversion factors for converting inches to centimeters and centimeters to inches.Key ConceptsRates can be used to convert a measurement in one unit to a corresponding measurement in another unit. We call rates that are used for such purposes conversion factors.The conversion factor 2.54 centimeters per inch is used to convert a measurement in inches to a measurement in centimeters (or, from the English system to the metric system).The conversion factor 0.3937 inches per centimeter is used to convert a measurement in centimeters to a measurement in inches (or, from the metric system to the English system).In the calculation, the inch units cancel out and the remaining centimeter units are the units of the answer, or vice versa.Goals and Learning ObjectivesExplore rate in the context of finding and using conversion factors.Understand that there are two conversion factors that translate a measurement in one unit to a corresponding measurement in another unit, and that these two conversion factors are inverses of one another.
In this lesson, students write formulas to represent different rate relationships.Key ConceptsA …
In this lesson, students write formulas to represent different rate relationships.Key ConceptsA formula is a mathematical way of writing a rule for computing a value.Formulas, like c = 2.50w or d = 20g, describe the relationship between quantities.The formula c = 2.50w describes the relationship between a cost and a quantity that costs $2.50 per unit of weight. Here, w stands for any weight, and c stands for the cost of w pounds at $2.50 per pound.The formula d = 20g describes the relationship between the distance, d, and the number of gallons of gas, g, for a car that gets 20 miles per gallon.Goals and Learning ObjectivesUse equations with two variables to express relationships between quantities that vary together.
In this lesson, students first watch three racers racing against each other. …
In this lesson, students first watch three racers racing against each other. The race is shown on a track and represented on a graph. Students then change the speed, distance, and time to create a race with different results. They graph the new race and compare their graph to the original race graph.Key ConceptsA rate situation can be represented by a graph. Each point on a graph represents a pair of values. In today's situation, each point represents an amount of time and the distance a racer traveled in that amount of time. Time is usually plotted on the horizontal axis. The farther right a point is from the origin, the more time has passed from the start. Distance is usually plotted on the vertical axis. The higher up a point is from the origin, the farther the snail has traveled from the start. A graph of a constant speed is a straight line. Steeper lines show faster speeds.Goals and Learning ObjectivesUnderstand that a graph can be a visual representation of an actual rate situation.Plot pairs of related values on a graph.Use graphs to develop an understanding of rates.
In this lesson, students watch a video of a runner and express …
In this lesson, students watch a video of a runner and express his speed as a rate in meters per second. Students then use the rate to determine how long it takes the runner to go any distance.Key ConceptsSpeed is a rate that is expressed as distance traveled per unit of time. Miles per hour, laps per minute, and meters per second are all examples of units for speed. The measures of speed, distance, and time are all related. The relationship can be expressed in three ways: d = rt, r = dt, t = dr.Goals and Learning ObjectivesExplore speed as a rate that measures the relationship between two aspects of a situation: distance and time.In comparing distance, speed, and time, understand how to use any two of these measures to find the third measure.
This lesson will allow students to explore an important role of environmental …
This lesson will allow students to explore an important role of environmental engineers: cleaning the environment. Students will learn details about the Exxon Valdez oil spill, which was one of the most publicized and studied environmental tragedies in history. In the accompanying activity, they will try many "engineered" strategies to clean up their own manufactured oil spill and learn the difficulties of dealing with oil released into our waters.
This lesson unit is intended to help sixth grade teachers assess how …
This lesson unit is intended to help sixth grade teachers assess how well students are able to: Analyze a realistic situation mathematically; construct sight lines to decide which areas of a room are visible or hidden from a camera; find and compare areas of triangles and quadrilaterals; and calculate and compare percentages and/or fractions of areas.
The purpose of this lesson is to introduce the students to the …
The purpose of this lesson is to introduce the students to the Sun. They explore various aspects of the Sun including its composition, its interior workings, and its relationship to the Earth.
In some textbooks, a distinction is made between a ratio, which is …
In some textbooks, a distinction is made between a ratio, which is assumed to have a common unit for both quantities, and a rate, which is defined to be a quotient of two quantities with different units (e.g. a ratio of the number of miles to the number of hours). No such distinction is made in the common core and hence, the two quantities in a ratio may or may not have a common unit. However, when there is a common unit, as in this problem, it is possible to add the two quantities and then find the ratio of each quantity with respect to the whole (often described as a part-whole relationship).
Students use real-world data to calculate the potential for solar and wind …
Students use real-world data to calculate the potential for solar and wind energy generation at their school location. After examining maps and analyzing data from the online Renewable Energy Living Lab, they write recommendations as to the optimal form of renewable energy the school should pursue.
Students use real-world data to evaluate whether solar power is a viable …
Students use real-world data to evaluate whether solar power is a viable energy alternative for several cities in different parts of the U.S. Working in small groups, they examine maps and make calculations using NREL/US DOE data from the online Renewable Energy Living Lab. In this exercise, students analyze cost and availability for solar power, and come to conclusions about whether solar power is a good solution for four different locations.
This lesson unit is intended to help teachers assess how well students …
This lesson unit is intended to help teachers assess how well students are able to solve a real-world modeling problem. There are several correct approaches to the problem, including some that involve proportional relationships.
Students learn about the major factors that comprise the design and construction …
Students learn about the major factors that comprise the design and construction cost of a modern bridge. Before a bridge design is completed, engineers provide overall cost estimates for construction of the bridge. Students learn about the components that go into estimating the total cost, including expenses for site investigation, design, materials, equipment, labor and construction oversight, as well as the trade-off between a design and its cost.
This lesson discusses how each component of a spacecraft is specifically designed …
This lesson discusses how each component of a spacecraft is specifically designed so that a rover can land safely in six minutes. Also, students will learn how common, everyday materials and technology, like nylon, polyester and airbags, are used in space-age technology.
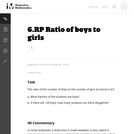
This is the first and most basic problem in a series of …
This is the first and most basic problem in a series of seven problems, all set in the context of a classroom election. Every problem requires students to understand what ratios are and apply them in a context. The problems build in complexity and can be used to highlight the multiple ways that one can reason about a context involving ratios.
This is the second in a series of tasks that are set …
This is the second in a series of tasks that are set in the context of a classroom election. It requires students to understand what ratios are and apply them in a context. The simple version of this question just asked how many votes each gets. This has the extra step of asking for the difference between the votes.
This problem, the third in a series of tasks set in the …
This problem, the third in a series of tasks set in the context of a class election, is more than just a problem of computing the number of votes each person receives. In fact, that isnŐt enough information to solve the problem. One must know how many votes it takes to make one half of the total number of votes. Although the numbers are easy to work with, there are enough steps and enough things to keep track of to lift the problem above routine.
This is the fourth in a series of tasks about ratios set …
This is the fourth in a series of tasks about ratios set in the context of a classroom election. What makes this problem interesting is that the number of voters is not given. This information isnŐt necessary, but at first glance some students may believe it is.
No restrictions on your remixing, redistributing, or making derivative works. Give credit to the author, as required.
Your remixing, redistributing, or making derivatives works comes with some restrictions, including how it is shared.
Your redistributing comes with some restrictions. Do not remix or make derivative works.
Most restrictive license type. Prohibits most uses, sharing, and any changes.
Copyrighted materials, available under Fair Use and the TEACH Act for US-based educators, or other custom arrangements. Go to the resource provider to see their individual restrictions.