Students apply what they know about light polarization and attenuation (learned in …
Students apply what they know about light polarization and attenuation (learned in the associated lesson) to design, build, test, refine and then advertise their prototypes for more effective sunglasses. Presented as a hypothetical design scenario, students act as engineers who are challenged to create improved sunglasses that reduce glare and lower light intensity while increasing eye protection from UVA and UVB radiation compared to an existing model of sunglasses—and make them as inexpensive as possible. They use a light meter to measure and compare light intensities through the commercial sunglasses and their prototype lenses. They consider the project requirements and constraints in their designs. They brainstorm and evaluate possible design ideas. They keep track of materials costs. They create and present advertisements to the class that promote the sunglasses benefits, using collected data to justify their claims. A grading rubric and reflection handout are provided.
Students drop water from different heights to demonstrate the conversion of water's …
Students drop water from different heights to demonstrate the conversion of water's potential energy to kinetic energy. They see how varying the height from which water is dropped affects the splash size. They follow good experiment protocol, take measurements, calculate averages and graph results. In seeing how falling water can be used to do work, they also learn how this energy transformation figures into the engineering design and construction of hydroelectric power plants, dams and reservoirs.
Students learn how to use and graph real-world stream gage data to …
Students learn how to use and graph real-world stream gage data to create event and annual hydrographs and calculate flood frequency statistics. Using an Excel spreadsheet of real-world event, annual and peak streamflow data, they manipulate the data (converting units, sorting, ranking, plotting), solve problems using equations, and calculate return periods and probabilities. Prompted by worksheet questions, they analyze the runoff data as engineers would. Students learn how hydrographs help engineers make decisions and recommendations to community stakeholders concerning water resources and flooding.
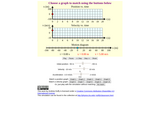
Students learn about four forms of equations: direct variation, slope-intercept form, standard …
Students learn about four forms of equations: direct variation, slope-intercept form, standard form and point-slope form. They graph and complete problem sets for each, converting from one form of equation to another, and learning the benefits and uses of each.
Students use graph theory to create social graphs for their own social …
Students use graph theory to create social graphs for their own social networks and apply what learn to create a graph representing the social dynamics found in a dramatic text. Students then derive meaning based on what they know about the text from the graphs they created. Students learn graph theory vocabulary, as well as engineering applications of graph theory.
Students learn about an important characteristic of lines: their slopes. Slope can …
Students learn about an important characteristic of lines: their slopes. Slope can be determined either in graphical or algebraic form. Slope can also be described as positive, negative, zero or undefined. Students get an explanation of when and how these different types of slope occur. Finally, they learn how slope relates to parallel and perpendicular lines. When two lines are parallel, they have the same slope and when they are perpendicular their slopes are negative reciprocals of one another.
Students analyze their social networks using graph theory. They gather data on …
Students analyze their social networks using graph theory. They gather data on their own social relationships, either from Facebook interactions or the interactions they have throughout the course of a day, recording it in Microsoft Excel and using Cytoscape (a free, downloadable application) to generate social network graphs that visually illustrate the key persons (nodes) and connections between them (edges). The nodes in the Cytoscape graphs are color-coded and sized according to the importance of the node (in this activity, nodes are people in students' social networks). After the analysis, the graphs are further examined to see what can be learned from the visual representation. Students gain practice with graph theory vocabulary, including node, edge, betweeness centrality and degree on interaction, and learn about a range of engineering applications of graph theory.
Students are introduced to different ways of displaying visual spectra, including colored …
Students are introduced to different ways of displaying visual spectra, including colored "barcode" spectra, like those produced by a diffraction grating, and line plots displaying intensity versus color, or wavelength. Students learn that a diffraction grating acts like a prism, bending light into its component colors.
Students visit second- and fourth-grade classes to measure the heights of older …
Students visit second- and fourth-grade classes to measure the heights of older students using large building blocks as a non-standard unit of measure. They also measure adults in the school community. Results are displayed in age-appropriate bar graphs (paper cut-outs of miniature building blocks glued on paper to form bar graphs) enabling a comparison of the heights of different age groups. The activities that comprise this activity help students develop the concepts and vocabulary to describe, in a non-ambiguous way, how heights change as children age. This introduction to graphing provides an important foundation for creating and interpreting graphs in future years.
This activity simulates the extraction of limited, nonrenewable resources from a "mine," …
This activity simulates the extraction of limited, nonrenewable resources from a "mine," so students can experience first-hand how resource extraction becomes more difficult over time. Students gather data and graph their results to determine the peak in resource extraction. They learn about the limitations of nonrenewable resources, and how these resources are currently used.
Engineers create and use new materials, as well as new combinations of …
Engineers create and use new materials, as well as new combinations of existing materials to design innovative new products and technologies—all based upon the chemical and physical properties of given substances. In this activity, students act as materials engineers as they learn about and use chemical and physical properties including tessellated geometric designs and shape to build better smartphone cases. Guided by the steps of the engineering design process, they analyze various materials and substances for their properties, design/test/improve a prototype model, and create a dot plot of their prototype testing results.
In this activity, students will conduct a survey to identify the environmental …
In this activity, students will conduct a survey to identify the environmental issues (in their community, their country and the world) for which people are concerned. They will tally and graph the results. Also, students will discuss how surveys are important when engineers make decisions about environmental issues.
Students learn about complex networks and how to use graphs to represent …
Students learn about complex networks and how to use graphs to represent them. They also learn that graph theory is a useful part of mathematics for studying complex networks in diverse applications of science and engineering, including neural networks in the brain, biochemical reaction networks in cells, communication networks, such as the internet, and social networks. Students are also introduced to random processes on networks. An illustrative example shows how a random process can be used to represent the spread of an infectious disease, such as the flu, on a social network of students, and demonstrates how scientists and engineers use mathematics and computers to model and simulate random processes on complex networks for the purposes of learning more about our world and creating solutions to improve our health, happiness and safety.
Students use a LEGO® ball shooter to demonstrate and analyze the motion …
Students use a LEGO® ball shooter to demonstrate and analyze the motion of a projectile through use of a line graph. This activity involves using a method of data organization and trend observation with respect to dynamic experimentation with a complex machine. Also, the topic of line data graphing is covered. The main objective is to introduce students graphs in terms of observing and demonstrating their usefulness in scientific and engineering inquiries. During the activity, students point out trends in the data and the overall relationship that can be deduced from plotting data derived from test trials with the ball shooter.
The learning of linear functions is pervasive in most algebra classrooms. Linear …
The learning of linear functions is pervasive in most algebra classrooms. Linear functions are vital in laying the foundation for understanding the concept of modeling. This unit gives students the opportunity to make use of linear models in order to make predictions based on real-world data, and see how engineers address incredible and important design challenges through the use of linear modeling. Student groups act as engineering teams by conducting experiments to collect data and model the relationship between the wall thickness of the latex tubes and their corresponding strength under pressure (to the point of explosion). Students learn to graph variables with linear relationships and use collected data from their designed experiment to make important decisions regarding the feasibility of hydraulic systems in hybrid vehicles and the necessary tube size to make it viable.
This activity is a culmnating assessment of students' abilities to describe a …
This activity is a culmnating assessment of students' abilities to describe a linear function in words, in an equation, in a table, in a graph, identify a solution, and explain the solution.
Students use latex tubes and bicycle pumps to conduct experiments to gather …
Students use latex tubes and bicycle pumps to conduct experiments to gather data about the relationship between latex strength and air pressure. Then they use this data to extrapolate latex strength to the size of latex tubing that would be needed in modern passenger sedans to serve as hybrid vehicle accelerators, thus answering the engineering design challenge question posed in the first lesson of this unit. Students input data into Excel spreadsheets and generate best fit lines by the selection of two data points from their experimental research data. They discuss the y-intercept and slope as it pertains to the mathematical model they generated. Students use the slope of the line to interpret the data collected. Then they extrapolate with this information to predict the latex dimensions that would be required for a full-size hydraulic accumulator installed in a passenger vehicle.
No restrictions on your remixing, redistributing, or making derivative works. Give credit to the author, as required.
Your remixing, redistributing, or making derivatives works comes with some restrictions, including how it is shared.
Your redistributing comes with some restrictions. Do not remix or make derivative works.
Most restrictive license type. Prohibits most uses, sharing, and any changes.
Copyrighted materials, available under Fair Use and the TEACH Act for US-based educators, or other custom arrangements. Go to the resource provider to see their individual restrictions.