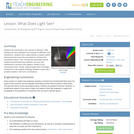
6.637 covers the fundamentals of optical signals and modern optical devices and …
6.637 covers the fundamentals of optical signals and modern optical devices and systems from a practical point of view. Its goal is to help students develop a thorough understanding of the underlying physical principles such that device and system design and performance can be predicted, analyzed, and understood. Most optical systems involve the use of one or more of the following: sources (e.g., lasers and light-emitting diodes), light modulation components (e.g., liquid-crystal light modulators), transmission media (e.g., free space or fibers), photodetectors (e.g., photodiodes, photomultiplier tubes), information storage devices (e.g., optical disk), processing systems (e.g., imaging and spatial filtering systems) and displays (LCOS microdisplays). These are the topics covered by this course.
Students use the spectrographs from the "Building a Fancy Spectrograph" activity to …
Students use the spectrographs from the "Building a Fancy Spectrograph" activity to gather data about light sources. Using their data, they make comparisons between different light sources and make conjectures about the composition of a mystery light source.
Students learn how using spectrographs helps people understand the composition of light …
Students learn how using spectrographs helps people understand the composition of light sources. Using simple materials including holographic diffraction gratings, students create and customize their own spectrographs just like engineers. They gather data about different light sources, make comparisons between sources and theorize about their compositions. Before building spectrographs, students learn and apply several methods to identify and interpret patterns, specifically different ways of displaying visual spectra. They also use spectral data from the Cassini mission to Saturn and its moon, Titan, to determine the chemical composition of the planet's rings and its moon's atmosphere.
Student groups rotate through four stations to examine light energy behavior: refraction, …
Student groups rotate through four stations to examine light energy behavior: refraction, magnification, prisms and polarization. They see how a beam of light is refracted (bent) through various transparent mediums. While learning how a magnifying glass works, students see how the orientation of an image changes with the distance of the lens from its focal point. They also discover how a prism works by refracting light and making rainbows. And, students investigate the polar nature of light using sunglasses and polarized light film.
Students are introduced to the technology of flexible circuits, some applications and …
Students are introduced to the technology of flexible circuits, some applications and the photolithography fabrication process. They are challenged to determine if the fabrication process results in a change in the circuit dimensions since, as circuits get smaller and smaller (nano-circuits), this could become very problematic. The lesson prepares students to conduct the associated activity in which they perform statistical analysis (using Excel® and GeoGebra) to determine if the circuit dimension sizes before and after fabrication are in fact statistically different. A PowerPoint® presentation and post-quiz are provided. This lesson and its associated activity are suitable for use during the last six weeks of the AP Statistics course; see the topics and timing note for details.
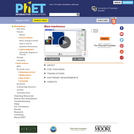
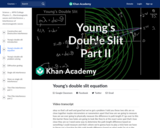
Thin film interference occurs when light waves reflecting off the top and …
Thin film interference occurs when light waves reflecting off the top and bottom surfaces of a thin film interfere with one another. This type of interference is the reason that thin films, such as oil or soap bubbles, form colorful patterns. Created by David SantoPietro.
Students use authentic spectral data from the Cassini mission of Saturn and …
Students use authentic spectral data from the Cassini mission of Saturn and Saturn's moon, Titan, gathered by instrumentation developed by engineers. Taking these unknown data, and comparing it with known data, students determine the chemical composition of Saturn's rings and Titan's atmosphere.
Students use the spectrograph from the "Building a Fancy Spectrograph" activity to …
Students use the spectrograph from the "Building a Fancy Spectrograph" activity to gather data about different light sources. Using the data, they make comparisons between the light sources and make conjectures about the composition of these sources.
Students make simple spectroscopes (prisms) to look at different light sources. The …
Students make simple spectroscopes (prisms) to look at different light sources. The spectroscopes allow students to see differing spectral distributions of different light sources. Students also shine a light source through different materials with varying properties and compare the differences.
Students learn about the types of waves and how they change direction, …
Students learn about the types of waves and how they change direction, as well as basic wave properties such as wavelength, frequency, amplitude and speed. During the presentation of lecture information on wave characteristics and properties, students take notes using a handout. Then they label wave parts on a worksheet diagram and draw their own waves with specified properties (crest, trough and wavelength). They also make observations about the waves they drew to determine which has the highest and the lowest frequency. With this knowledge, students better understand waves and are a step closer to understanding how humans see color.
Students are introduced to the concept of refraction. After making sure they …
Students are introduced to the concept of refraction. After making sure they understand the concepts of diffraction and interference, students work collaboratively to explain optical phenomena that cannot be accounted for via these two mechanisms alone. Then, through the associated activity, students see first-hand how refraction can work with interference to produce color patterns, similar to how nanosensors work. Finally, students apply their knowledge of refraction to the original challenge question to generate a possible solution in the form of a biosensor.
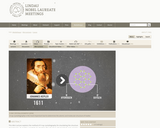
This Mini Lecture explains the method of X-ray crystallography for elucidating the …
This Mini Lecture explains the method of X-ray crystallography for elucidating the structure of molecules. It enables scientists to decipher the structure of important and complex biochemical molecules and helps them to understand their function. Starting from the x-ray diffraction by crystal lattices, first described by the physicist Max von Laue, to the decoding of the most complex molecular structures, this Mini Lecture illuminates the history of the X-ray analysis.
No restrictions on your remixing, redistributing, or making derivative works. Give credit to the author, as required.
Your remixing, redistributing, or making derivatives works comes with some restrictions, including how it is shared.
Your redistributing comes with some restrictions. Do not remix or make derivative works.
Most restrictive license type. Prohibits most uses, sharing, and any changes.
Copyrighted materials, available under Fair Use and the TEACH Act for US-based educators, or other custom arrangements. Go to the resource provider to see their individual restrictions.