This video on phenology of plants and bees discusses the MODIS satellite …
This video on phenology of plants and bees discusses the MODIS satellite finding that springtime greening is happening one half-day earlier each year and correlates this to bee pollination field studies.
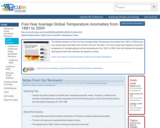
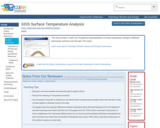
This color-coded map displays a progression of changing five-year average global surface …
This color-coded map displays a progression of changing five-year average global surface temperatures anomalies from 1880 through 2010. The final frame represents global temperature anomalies averaged from 2006 to 2010. The temperature anomalies are computed relative to the base period 1951-1980.
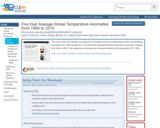
This NASA animation of the Five-Year Average Global Temperature Anomalies from 1881 …
This NASA animation of the Five-Year Average Global Temperature Anomalies from 1881 to 2009 shows how temperature anomalies have varied in the last 130 years. The color-coded map displays a long-term progression of changing global surface temperatures from 1881 to 2009. Dark red indicates the greatest warming and dark blue indicates the greatest cooling.
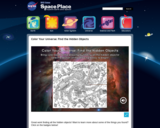
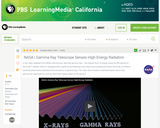
This video from NASA describes the GLAST satellite, which is equipped with …
This video from NASA describes the GLAST satellite, which is equipped with a gamma-ray telescope, and shares some background about the kinds of extreme universal phenomena indicated by the presence of gamma rays.
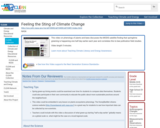
With this simulation from the NASA Climate website, learners explore different examples …
With this simulation from the NASA Climate website, learners explore different examples of how ice is melting due to climate change in four places where large quantities of ice are found. The photo comparisons, graphs, animations, and especially the time lapse video clips of glaciers receding are astonishing and dramatic.
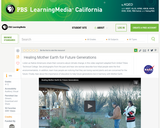
In this video segment adapted from United Tribes Technical College, meet Native …
In this video segment adapted from United Tribes Technical College, meet Native Americans who are concerned about climate change and believe that action today can help future generations once again live in harmony with Earth.
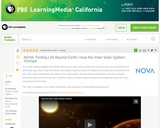
In this video segment adapted from NOVA, explore the theory that small …
In this video segment adapted from NOVA, explore the theory that small bits of gas and dust combined to form protoplanets billions of years ago, which in turn collided to create the four rocky planets of the inner solar system.
Would you like to learn how to make your own Demo-2 to …
Would you like to learn how to make your own Demo-2 to launch in your home? Watch this tutorial to learn how.
All you will need is paper, markers, scissors, tape, yarn or ribbon (optional) and a straw.
How are you preparing to #LaunchAmerica? From building your own rocket to binge-watching launch videos, share a video, a photo or simply your thoughts using #LaunchAmerica for a chance to be featured on our social media platforms.
This video is available for download from NASA's Image and Video Library
In this activity, students examine the effects of hurricanes on sea surface …
In this activity, students examine the effects of hurricanes on sea surface temperature using NASA data. They examine authentic sea surface temperature data to explore how hurricanes extract heat energy from the ocean surface.
No restrictions on your remixing, redistributing, or making derivative works. Give credit to the author, as required.
Your remixing, redistributing, or making derivatives works comes with some restrictions, including how it is shared.
Your redistributing comes with some restrictions. Do not remix or make derivative works.
Most restrictive license type. Prohibits most uses, sharing, and any changes.
Copyrighted materials, available under Fair Use and the TEACH Act for US-based educators, or other custom arrangements. Go to the resource provider to see their individual restrictions.