Updating search results...

Search Resources

13 Results

View
Selected filters:
Beartooth Highway Field Trip and Activities
Conditional Remix & Share Permitted
CC BY-NC-SA
Rating
0.0 stars

During the course of the day, students examine the high-grade metasupracrustal rocks, related gneisses, and the late Archean granitoids and mafic dikes. We have prepared a number of exercises that might be done with classes at different levels. Depending on the background and preparation of your class you might want to emphasize different learning skills specific to the class level: observation, interpretation, integration (i.e. multiple lines of evidence focused on a given problem), and synthesis (i.e. relationship to the "big picture", drawing from the corpus of geologic knowledge). We have also prepared a compilation of our key scientific results, but these are under seal and we'd like you to do the exercises first as if you were students before taking a look at the supporting evidence.

(Note: this resource was added to OER Commons as part of a batch upload of over 2,200 records. If you notice an issue with the quality of the metadata, please let us know by using the 'report' button and we will flag it for consideration.)

Subject:
Biology
Life Science
Material Type:
Activity/Lab
Provider:
Science Education Resource Center (SERC) at Carleton College
Provider Set:
Teach the Earth
Author:
Dave Mogk
Date Added:
08/29/2019
Beartooth Highway Field Trip and Activities
Conditional Remix & Share Permitted
CC BY-NC-SA
Rating
0.0 stars

During the course of the day, students examine the high-grade metasupracrustal rocks, related gneisses, and the late Archean granitoids and mafic dikes. We have prepared a number of exercises that might be done with classes at different levels. Depending on the background and preparation of your class you might want to emphasize different learning skills specific to the class level: observation, interpretation, integration (i.e. multiple lines of evidence focused on a given problem), and synthesis (i.e. relationship to the "big picture", drawing from the corpus of geologic knowledge). We have also prepared a compilation of our key scientific results, but these are under seal and we'd like you to do the exercises first as if you were students before taking a look at the supporting evidence.

(Note: this resource was added to OER Commons as part of a batch upload of over 2,200 records. If you notice an issue with the quality of the metadata, please let us know by using the 'report' button and we will flag it for consideration.)

Subject:
Biology
Life Science
Material Type:
Activity/Lab
Module
Provider:
Science Education Resource Center (SERC) at Carleton College
Provider Set:
Teach the Earth
Author:
Darrell Henry
Dave Mogk
Date Added:
12/30/2020
Calculating Compositional Variation and Common Substitutions for Igneous and Metamorphic Minerals
Conditional Remix & Share Permitted
CC BY-NC-SA
Rating
0.0 stars

This exercise uses a number of Excel spreadsheets to calculate mineral formulae from compositional (microprobe) data. Numerous computational models are presented for most mineral groups (e.g. amphiboles, pyroxenes, micas), and students must critically evaluate which of these models is most applicable. Stoichiometry and charge balance are used to determine ferric/ferrous ratios--which is important for further applications such as geothermobarometry. Students are also asked directed questions about: compositional variation of the rock-forming mineral groups; representative complete, limited, and coupled solid solutions; site occupancy of major elements, as determined by the various computational models used; graphical representation of the calculated mineral formulae; and the composition and significance of certain varieties of these rock-forming minerals are addressed.

(Note: this resource was added to OER Commons as part of a batch upload of over 2,200 records. If you notice an issue with the quality of the metadata, please let us know by using the 'report' button and we will flag it for consideration.)

Subject:
Biology
Chemistry
Life Science
Physical Science
Physics
Material Type:
Activity/Lab
Provider:
Science Education Resource Center (SERC) at Carleton College
Provider Set:
Teach the Earth
Author:
Dave Mogk
Date Added:
08/29/2020
Critical Review of a Journal Article: An Assessment Activity
Conditional Remix & Share Permitted
CC BY-NC-SA
Rating
0.0 stars

Students receive a "Dear Colleague" letter requesting the review of a journal article in the same format as would be received from an Assistant Editor of a major scholarly journal. The letter outlines the requirements of the review and the due date. Students also receive the review forms typically provided by a given journal (I've provided forms from the Geological Society of America Bulletin and American Mineralogist for use in an upper division course in Mineralogy, Igneous and Metamorphic Petrology. The GSA Bulletin form is better suited for manuscripts that report on articles that have a significant field or tectonic component; the American Mineralogist form is better suited for articles that focus on more analytical, theoretical, or computational applications in mineralogy and petrology.

In an upper division petrology class, I typically select articles for review that integrate numerous aspects of topics we've recently covered in class; tectonic setting, field relations, petrography, whole-rock geochemistry, geo- and thermochronology, mineral chemistry (for PTt calculations), stable isotope geochemistry, etc. My goal is to help students see how these multiple lines of evidence must be integrated into a coherent geologic interpretation of geologic process or history.

Modify the letter with the request for review and review forms to emphasize the particular course goals, content, and expectations for your own course.

(Note: this resource was added to OER Commons as part of a batch upload of over 2,200 records. If you notice an issue with the quality of the metadata, please let us know by using the 'report' button and we will flag it for consideration.)

Subject:
Biology
Geology
Life Science
Physical Science
Material Type:
Homework/Assignment
Provider:
Science Education Resource Center (SERC) at Carleton College
Provider Set:
Teach the Earth
Author:
Dave Mogk
Date Added:
08/17/2022
Directed Discovery of Crystal Structures
Conditional Remix & Share Permitted
CC BY-NC-SA
Rating
0.0 stars

This contribution is modified from a published exercise "Directed Discovery of Crystal Structures Using Ball-and-Stick Models" [Mogk, 1997] . While the published exercise is based on student exploration of traditional ball-and-stick models of crystal structures, this modified version uses a similar "discovery-based" approach and the latest online crystallographic information and visualization software to teach the spatial relationships and crystal-chemical rules that govern the crystal structures of common minerals and crystalline solids. A few changes in the content have been made from the published exercise, mainly to accommodate the new digital media.

(Note: this resource was added to OER Commons as part of a batch upload of over 2,200 records. If you notice an issue with the quality of the metadata, please let us know by using the 'report' button and we will flag it for consideration.)

Subject:
Chemistry
Physical Science
Material Type:
Activity/Lab
Provider:
Science Education Resource Center (SERC) at Carleton College
Provider Set:
Teach the Earth
Author:
Dave Mogk
Kent Ratajeski
Date Added:
09/07/2020
Directed-Discovery of Crystal Structures Using Ball and Stick Models
Conditional Remix & Share Permitted
CC BY-NC-SA
Rating
0.0 stars

In this series of exercises, a kind of reductionist approach is used to direct the students attention to specific characteristics of a variety of ball and stick models. Through a series of leading questions, students must focus on specific relationships and must rationalize these relationships according to the fundamental principles of crystal chemistry and crystallography. In this way, students will simulate and replicate the kinds of questions we would normally ask in our professional careers as mineralogists. This approach also addresses other major recommendations from Project 2061: start with questions about nature, and concentrate on the collection and use of evidence. Other questions ask students to make connections to basic chemistry (e.g. bond types, relative strength of bonds, bond angles), determinative mineralogy (most likely place to develop cleavage), analytical techniques (e.g. preferred orientations for X-ray analysis), and so on. The final reflection questions will allow students to "discover" Pauling's Rules, a much more effective learning strategy than simple memorization of these rules (commonly with little or no understanding on the part of the students).

(Note: this resource was added to OER Commons as part of a batch upload of over 2,200 records. If you notice an issue with the quality of the metadata, please let us know by using the 'report' button and we will flag it for consideration.)

Subject:
Chemistry
Physical Science
Material Type:
Activity/Lab
Homework/Assignment
Provider:
Science Education Resource Center (SERC) at Carleton College
Provider Set:
Teach the Earth
Author:
Dave Mogk
Date Added:
08/09/2019
Ethical Dilemmas of Backcountry Skiing and Guiding
Conditional Remix & Share Permitted
CC BY-NC-SA
Rating
0.0 stars

This case study explores decision-making in high risk settings such as back-country skiing. The scenarios presented have application to many field-based studies where of physical injury or even death may be an outcome in circumstances that have known predictable risks that must be evaluated. Go? or No Go? What factors must be considered to ensure the safety of the group while achieving desired objectives? What are the ethical responsibilities of group leaders and group members in high-risk situations? Recommended readings on high-risk decision making are provided.

(Note: this resource was added to OER Commons as part of a batch upload of over 2,200 records. If you notice an issue with the quality of the metadata, please let us know by using the 'report' button and we will flag it for consideration.)

Subject:
Biology
Life Science
Material Type:
Activity/Lab
Case Study
Provider:
Science Education Resource Center (SERC) at Carleton College
Provider Set:
Teach the Earth
Author:
Dave Mogk
Date Added:
08/17/2022
Field Notes
Conditional Remix & Share Permitted
CC BY-NC-SA
Rating
0.0 stars

Field Notes provides instructors with helpful tips for a successful field trip. The tips include a well-developed literature review for designing and assessing field trips.

(Note: this resource was added to OER Commons as part of a batch upload of over 2,200 records. If you notice an issue with the quality of the metadata, please let us know by using the 'report' button and we will flag it for consideration.)

Subject:
Biology
Geology
Life Science
Physical Science
Material Type:
Activity/Lab
Provider:
Science Education Resource Center (SERC) at Carleton College
Provider Set:
Teach the Earth
Author:
Dave Mogk
Date Added:
08/09/2019
Geoethics Case Study: The Keystone Pipeline--Energy, Jobs or Environment?
Conditional Remix & Share Permitted
CC BY-NC-SA
Rating
0.0 stars

The Keystone Pipeline is a complex project that raises important environmental, economic, and international policy issues. Tar sands from Alberta Canada will be mined and processed and transported on a ~1700 mile pipeline to refineries in the United States. How should decisions be made responsibly and ethically to balance societal energy needs with anticipated environmental impacts related to mining and processing the tar sands and the ultimate impacts on climate change.

(Note: this resource was added to OER Commons as part of a batch upload of over 2,200 records. If you notice an issue with the quality of the metadata, please let us know by using the 'report' button and we will flag it for consideration.)

Subject:
Biology
Life Science
Material Type:
Activity/Lab
Case Study
Homework/Assignment
Provider:
Science Education Resource Center (SERC) at Carleton College
Provider Set:
Teach the Earth
Author:
Dave Mogk
Date Added:
09/29/2022
Guided Discovery and Scoring Rubric for Petrographic Analysis of a Thin Section
Conditional Remix & Share Permitted
CC BY-NC-SA
Rating
0.0 stars

A series of spread sheets have been set up to provide a framework of observations and questions as a "guided discovery" exercise to clearly demonstrate the observations that a master petrographer would make. The observation of a thin section is broken down into a series of manageable tasks: reconnaissance overview of the thin section at low power; followed by creation of a systematic inventory of the rock-forming minerals (stable mineral paragenesis), alteration phases, and accessory minerals; and finally, analysis of the textures of igneous, sedimentary and metamorphic rocks.

Comprehensive lists of a) optical determinations, and b) textural features are provided as "cues" to the student to help focus attention on the full range of observations that could or should be made towards a comprehensive petrographic analysis of the thin section. These sheets are organized to include:

Consideration of the geologic context of the sample: What is the geologic setting where the rock was collected? What is the rock type (if known), or at least is it igneous, sedimentary or metamorphic? This type of contextual information will help guide you to interpret what minerals are likely to be present (or excluded) in the sample
Mineral Optics (identification of mineral phases in thin section.

Observations at low power in plane and cross polarized light.
Systematic characterization of the (stable) rock-forming minerals
Identification of a) secondary or replacement minerals, and b) important accessory minerals;

Description and Interpretation of Rock Textures

Igneous rocks
Clastic Sedimentary rocks
Non-clastic Sedimentary rocks (carbonates)
Metamorphic rocks

Applications; can these minerals/assemblages/textures be used to determine source area, physical conditions (thermobarometry), geo- or thermochronology, and other useful geologic information?

Initially, use of these spread sheets will appear to be prescriptive. However, given the complexity observed in Nature, no single set of questions can be universally applied to all types of samples. So, the steps and observations represented in these spread sheets provide a general framework--a place to start--and the lists of optical properties and textures are meant to be a reminder to students about the types of observations that should be made. Students can use these spread sheets as a guide to make decisions about what is important and useful for the overall interpretation.
Metacognitive components of the activity

Students derive an awareness of their own learning processes by considering "what" they are doing and "why" they are performing certain operations on the petrographic microscope.
Students monitor their own progress by considering a) what they expect to find based on geologic contexts, b) are their observations and interpretations consistent with what can (or cannot) occur in Nature, and
Adjust their learning strategies to accomodate new lines of evidence towards formulation of internally consistent (if not "correct") observations and interpretations of the thin section.

Metacognitive goals for this activity:
The first encounter with an unknown thin section can be both confusing and overwhelming: Where do I start? What should I look for? How should I proceed? How will I know if I'm doing the right thing, and making the right observations?....

The purpose of this exercise is to "unpack" the steps taken by a master petrographer, to describe "what" observations can be made, and explain "why" these steps should be taken, what the utility or significance of the observations is, and how these observations can be appropriately interpreted (often these observations are done instantaneously in the mind of the petrographer, but in this exercise we try to explicitly outline these steps). With practice and experience these steps will become second nature. The goal of this exercise is to help students master the art of petrography so that they can independently do petrographic analysis of any rock from any context.
Assessing students' metacognition
In the course of teaching petrography in my regular coursework, I find that I continually articulate to students (one at a time) what I am doing (and why), what I am seeing (and they may or may not be seeing the same thing), why certain relationships are to be expected or prohibited in Nature (by considering the larger geologic context). The development of these guided discovery activities is an attempt to clearly articulate to all students the steps that are routinely taken in the petrographic analysis of a thin section. The goal is to more efficiently and effectively get students past the "mechanical" stages of mineral identification and textural descriptions, and help them to begin to develop higher order thinking skills of application, analysis, synthesis, and evaluation.

(Note: this resource was added to OER Commons as part of a batch upload of over 2,200 records. If you notice an issue with the quality of the metadata, please let us know by using the 'report' button and we will flag it for consideration.)

Subject:
Biology
Geology
Life Science
Physical Science
Physics
Material Type:
Activity/Lab
Provider:
Science Education Resource Center (SERC) at Carleton College
Provider Set:
Teach the Earth
Author:
Dave Mogk
Date Added:
08/23/2020
Mineral Classification - What's in a Name?
Conditional Remix & Share Permitted
CC BY-NC-SA
Rating
0.0 stars

Students think about the nature of classification systems and about properties that are most useful for classifying minerals as they derive their own hierarchical scheme, or key, for identifying and naming mineral species. When finished, they read Mineralogy: A Historical Review by Robert M. Hazen and revise their classification scheme. Finally, groups trade their systematic plans and identify unknown mineral samples with them, comenting on the usefullness of the various methods.

(Note: this resource was added to OER Commons as part of a batch upload of over 2,200 records. If you notice an issue with the quality of the metadata, please let us know by using the 'report' button and we will flag it for consideration.)

Subject:
Biology
Life Science
Material Type:
Activity/Lab
Provider:
Science Education Resource Center (SERC) at Carleton College
Provider Set:
Teach the Earth
Author:
Dave Mogk
Dexter Perkins
Date Added:
09/07/2020
Modeling Exsolution (and Perthite Formation) as an Example of Complex-System Behavior
Conditional Remix & Share Permitted
CC BY-NC-SA
Rating
0.0 stars

Show Caption
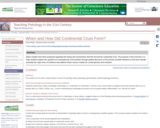
Hide This diagram shows the relationship of Gibbs Free Energy to composition. In this diagram there are two minima represented for free energy which is achieved by unmixing of two distinct phases each with definite composition. The dashed line, which is tangential to the two minima in the free energy curves, gives the composition of the coexisting minerals at a specific temperature. From: Klein, C., and Dutrow, B., Manual of Mineral Science, 23rd ed., J. Wiley and Sons. Used with permission. The phenomenon of solid solution is common in many rock-forming minerals. At high temperatures, thermal vibrations permit accomodation of ions with size differences on the order of 15-30%. However, as physical conditions change, ions no longer fit into similar sites which creates internal (lattice) strain energy. Consequently, the mineral composition must adjust to relieve this strain energy and minimize the Gibbs Free Energy of the system. One possible response of the system is for elements in a crystal to move from one chemical site to another via intracrystalline diffusion. This results in segregated domains that are enriched in one element or another--this is a process called exsolution.
A good example of this process can be seen in the alkali feldspar mineral group. At high temperature the mineral anorthoclase (K,Na)AlSi3O8 shows complete solid solution, i.e. there is a random distribution of K and Na in the alkali sites of the crystal. Upon cooling, Na and K segregate into more ordered domains creating areas that are rich in albite NaAl Si3O8 and microcline KAlSi3O8(see Figure 1).
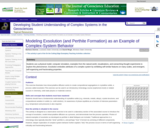
The purpose of this exercise is to provide a number of activities to demonstrate how exsolution works and to demonstrate complex-system behavior in this relatively common natural phenomenon.

Part I: Images of naturally occurring perthite.
The following images show minerals that have undergone exsolution at different scales. The image on the top left shows exsolution as viewed with a Transmission Electron Microscope (TEM; field of view is 10 microns). The image on the top right is a photomicrograph of exsolution in microcline as seen in thin section (cross-polarized light, field of view is 2 mm). The picture on the bottom left is a hand sample of perthitic microcline as seen in hand sample (field of view is 10 cm). The picture on the bottom right is a picture of plagioclase feldspar showing the "schiller" effect. This is caused by sub-microscopic unmixing of two distinct plagioclase phases in the compositional range of labradorite (An50 - An70) which results in the beautiful play of colors seen in this photo; (field of view of 20 centimeters). This series of pictures is a good example of scale invariance of this physical phenomenon.
Examine perthite textures from hand samples and thin sections from your own mineralogy collection. We can easily envision unmixing of two immiscible fluids--for example oil and vinegar salad dressing. The same thing happens when we unmix (i.e. exsolve) solid phases--the process just takes a bit longer as atoms have to migrate in the crystal lattice by intracrystalline diffusion! How can such a common feature as perthite be understood in terms of complex-system behavior?

Exsolution observed on a sub-microscopic scale in this TEM picture; this microstructure shows unmixing of labradorite in very fine essentially parallel lamellae. From Champness, P.E., and G.W Lorimer, 1976. Exsolution in silicates. Chapter 4.1 in Electron Microscopy in Mineralogy. H.R. Wenk, ed. Springer-Verlag, New York. Field of view is 10 microns.

Perthite observed in thin section. Field of view is 2 mm.

Perthite observed in hand sample. Field of View is 10 cm.

Unmixing of parallel lamellae, as observed in a hand specimen of labradorite from Madagascar. These lamellae act as diffraction grating for white light, producing spectral colors known as labradorescence or the "schiller effect"; the field of view is 20 cm. Photo by B. Dutrow; used by permission.]

Part II: Exsolution Puzzle Exercise.
This exercise is done in groups of 2-3 students. Coins are initially randomly distributed on a chessboard, and are then subsequently moved to create domains of increasing order (regions that are dominated by either pennies or nickels). This is a kinesthetic learning exercise that creates a physical model that simulates how the exsolution process works. (Inspired by Greg Marfleet, Carleton College)

Randomly distribute 20 pennies and 20 nickels on the attached 7x7 chessboard (Microsoft Word 33kB Dec1 10). The random distribution of pennies and nickels is analogous to the random distribution of Na and K in the high temperature alkali feldspar, anorthosite. (See Figure 1)
The goal is to have a given coin completely surrounded by similar neighbors (i.e. 8 nearest neighbors of the same type of coin located on adjacent edges and the diagonal squares. Each student will sequentially move a coin into an adjacent open position (horizontal, vertical and diagonal moves are allowed) to achieve this desired configuration. Perfect ordering of nickels and pennies into discrete domains is analogous to perfectly ordered crystals of albite and microcline. [NOTE: in this exercise we are modeling the diffusivity of only the alkali elements, Na and K. The ordering of Si and Al in the tetrahedral sites of a feldspar crystal is a related, but entirely different process].
Systems tend to minimize Gibbs Free Energy (see Figure 2) on their way towards a state of equilibrium. In this example, the surface area surrounding domains of the segregated compositions (nickels/Na and pennies/potassium) is proportional to the excess Gibbs Free Energy of those domains. As clusters of similar coins evolve (segregate) and get bigger, the bounding surface areas are minimized and the energetics of the system are decreased.

INSTRUCTIONS

For the initial random state, determine the area surrounding each type of element; do this by assuming the unit length along each edge is 1 and add all the surfaces surrounding Na/nickel and K/potassium coins or aggregates of coins. Count any edges that are not adjacent to another similar coin (i.e. count all nickel-penny interfaces, and any edge where a nickel or penny is adjacent to an open space. Do not count the external edges on the outer border of the chessboard).
Make 10 moves of the coins (always moving into an adjacent open space either right, left, up, down, or on a diagonal) and again determine the bounding surface areas. Record these surface area values for pennies and nickels. Repeat after 20, 30, 40, 50, and 100 moves.
After each set of moves, report your surface area measurements for both pennies and nickels to your instructor; record these values on a spread sheet for later plotting and analysis.
This part of the exercise should take about 45 minutes to complete the sets of movements and measurement of the surface areas.

Here is an example experiment showing the progressive ordering of pennies (potassium) and nickels (sodium). Show pictures of the 2-D distribution of pennies and nickels after 10,20, 30, 40, 50 and 100 successive moves
Hide

Original random distribution of coins.

Distribution of coins after 10 moves.


Distribution of coins after 20 moves.

Distribution of coins after 30 moves.


Distribution of coins after 40 moves.

Distribution of coins after 50 moves.


Distribution of coins after 100 moves; perfect order.

Plot your results. Assume that each move requires 1 unit of time.

Plot your data on a X-Y plot with surface area on the Y axis and time on the X-axis. What is the distribution of your data? (Try plotting data for pennies, nickels, their sum, and their averages). Create a "best fit" curve through the data as plotted on this X-Y diagram (easily done with functions programmed into Excel). . What type of mathematical function is represented by a curve that has a steep slope to begin (left side of the plot), and becomes asymptotic to the X-axis away from the origin? Did you notice that the first set of coin moves produced the largest change in surface area, and that subsequent sets of moves produced smaller and smaller changes to the surface area?
Have you seen other plots with similar profiles from your other studies in Earth Science?
Show Answer:
Hide radioactive decay; longitudinal profile of rivers.... It appears that many processes in Earth Science may follow the same mathematical laws.
Now plot your data on a log-log plot with surface area on the ordinate (Y-axis) and time on the abscissa (X-axis). Create a "best fit" curve through these data (easily done with functions programmed into Excel). What is the shape of this curve? Does this relationship demonstrate a) an exponential function? b) a power law?
Here is an example dataset (Excel 74kB Dec1 10) for 12 experiments completed by the spring 2010 Mineralogy class at Montana State University. Raw data and corresponding graphs are presented in the attached spreadsheet file. Compare your results with those shown in this example exercise.

Intracrystalline Diffusion and Fick's Law
The rate of transport of mass (and energy) through a fixed medium can be described mathematically by Fick's Law of Diffusion. Show details about Fick's Law of Diffusion
Hide.
The fundamental expression of Fick's First Law of Diffusion can be written as:


J = -D( -- c/ -- x)


Jis the flux of a material along a compositional gradient (e.g. mol / length2time1 ), the amount of material (e.g. atoms or moles) that will flow through a small area during a fixed time interval.
Dis the diffusion coefficient (length2 time -1);
c is the concentration (amount of material per volume, mol/m3), and
x is the length (m)
Fick's Law shows that the flux of an ion diffusing through a stationary medium (like the crystalline lattice in our example) is proportional to the concentration gradient ( -- c/ -- x). As diffusion proceeds, the concentration is always changing, and thus, the flux is always changing. Can you see why this process exhibits non-linear behavior and must be represented as a power law?
Note that The diffusivity, D, scales with temperature:

D ~ (kT/h) exp(-Q*/RT)

where k is Boltzmann's constant, h is Planck's constant, and Q* is an activation energy. This means that the rate of diffusion decreases with temperature. Consequently, exsolution will ultimately grind to a halt as temperature decreases. This is why we can observe perthite development in alkali feldspars in a wide variety of igneous and metamorphic rocks...the perthite texture gives us information about the cooling history of the mineral up to a point, but then exsolution will slow to a stop and the perthite will continue to exist in a metastable state at the surface of the earth.
Different types of diffusion pathways include: intragranular (volume) diffusion, grain boundary diffusion, diffusion in a bulk fluid, and diffusion related to crystal defects. In our example of perthite exsolution, intragranular (volume) diffusion is the operative process. This process is most effective at high temperatures.

Note that generally material tends to move in a direction from high to low concentrations, and thus, compositional gradients tend to be minimized by diffusion. However, in the case of exsolution and perthite development during cooling of a high-temperature, homogeneous alkali feldspar (anorthite), just the opposite effect happens--segregated domains of albite and microcline become more stable at lower temperatures. Why is this the case? The answer lies in the overall energetics of the system. It turns out that lattice strain that is induced upon cooling of anorthite results in large excess energy in the system. To minimize this excess energy, a single homogeneous grain of anorthite (stable at high temperature), will undergo "spinodal" decomposition upon cooling. This results in two energy minima, one for each phase, as illustrated in Figure 2. Upon further cooling, these energy minima continue to separate, thus resulting in two stable phases whose compositions increasingly approach the end member compositions of albite and microcline. A more complete description of this process can be found in Chapters 5 and 7 of Putnis A. and McConnell J.D.C. Principles of Mineral Behaviour 258pp. Blackwell Scientific Publications. Oxford. 1980.
Part III: Computer Simulation

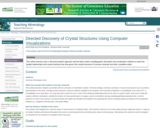
Model output from the NetLogo "segregation"program; 2000 objects achieved 70% similarity.The computer program NetLogo can be used to model complex system behavior. This computer program was developed by Uri Wilensky (1999) at the Center for Connected Learning and Computer-Based Modeling, Northwestern University. Evanston, IL. For this exercise, we will use the pre-programmed function for Segregation

Experiment with this program by changing the input parameters to try to reproduce a) the pattern you developed in the puzzle model above, and b) perthite patterns observed in the natural microcline crystals.


Part IV: Visualization of the Development of Exsolution

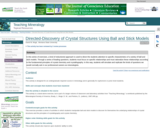
The binary solvus phase diagram for the alkali feldspar system at low pressure. Figure provided by Dexter Perkins, used with permission.The binary "solvus" phase diagram (showing the relation of temperature to composition) is typically used to show the phase relations for alkali feldspars. A single homogeneous alkali feldspar occurs at high temperatures (Figure 1a), but as the system cools eventually the phase boundary (solvus) is intersected and the exsolution (unmixing) process begins. "Underneath" the solvus a single feldspar is no longer thermodynamically stable, and the system begins to separate into two phases that become increasingly Na-rich or K-rich upon further cooling. This visualization demonstrates the cooling history of an alkali feldspar, including use of the "lever rule" to calculate phase composition (mineral) and relative proportions. Examine the accompanying illustrations and track the "state" of the system as temperature changes. Binary Solvus for the Alkali Feldspar System. The accompanying illustrations on the right show the "state of the system" in terms of the relative proportions of the phases present for each assigned temperature.
Relate these products and processes to natural occurrences of perthite, and think about the changes that have to take place on the atomic scale to produce the mesoscopic features that are visible in hand samples.

Part V: Thought Questions

Driving forces: in equilibrium thermodynamics, the system always drives towards the lowest Gibbs Free Energy. At equilibrium, chemical potential is zero. This typically means there are no compositional gradients. Why does this system drive towards segregated domains that are rich in Na and K?
Consider entropy "in the system". What do we mean by "the system"?
Refer to Ilya Prigogine's (winner of the 1977 Nobel Prize for Chemistry) classic work on this subject: Order out of Chaos, Man's New Dialogue with Nature (1984, Bantam Books, 394 pp.)

(Note: this resource was added to OER Commons as part of a batch upload of over 2,200 records. If you notice an issue with the quality of the metadata, please let us know by using the 'report' button and we will flag it for consideration.)

Subject:
Chemistry
Physical Science
Physics
Material Type:
Activity/Lab
Provider:
Science Education Resource Center (SERC) at Carleton College
Provider Set:
Teach the Earth
Author:
Barb Dutrow
Dave Mogk
Date Added:
09/28/2022
When and How Did Continental Crust Form?
Conditional Remix & Share Permitted
CC BY-NC-SA
Rating
0.0 stars

Given the extensive literature on the composition and evolution of continental crust there are a number of teaching strategies that can be employed to encourage active learning by students. A critical reading of this collection of articles will provide students with a good opportunity to evaluate the chemical isotopic and physical evidence that has led to the development of these models of continental crustal growth. These instructional approaches build on recommendations from Project 2061, Science for all Americans:
1) Start with questions about nature.
2) Engage students actively.
3) Concentrate onthe collection and use of evidence.
4) Provide historical perspectives.
5) Use a team approach.
6) Do not separate knowing from finding out.
A compilation from the primary literature has been provided (see the reference list at the end of this web page: http://serc.carleton.edu/NAGTWorkshops/earlyearth/questions/crust.html), along with guiding questions for deeper exploration and discovery. Recommended instructional methods include: jigsaw method, role playing or debates (have each student play the role of Richard Armstrong, Ross Taylor, William Fyfe...), reading the primary literature, or problem-based learning (which is purposefully ambiguous and addresses questions that require independent discovery).

(Note: this resource was added to OER Commons as part of a batch upload of over 2,200 records. If you notice an issue with the quality of the metadata, please let us know by using the 'report' button and we will flag it for consideration.)

Subject:
Biology
Chemistry
Geology
Life Science
Mathematics
Measurement and Data
Physical Science
Statistics and Probability
Material Type:
Activity/Lab
Provider:
Science Education Resource Center (SERC) at Carleton College
Provider Set:
Teach the Earth
Author:
Dave Mogk
Date Added:
09/08/2020