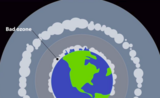
This 7-minute video illustrates how the historic homeland for Arctic Native Americans …
This 7-minute video illustrates how the historic homeland for Arctic Native Americans is being affected by climate change. Shorefast ice and pack ice are present for a shorter part of the year. This has profound affects on the way of life in the Bering Sea region, to the point where the community may have to relocate.
This video discusses how the historic way of life for Arctic Native …
This video discusses how the historic way of life for Arctic Native Americans has changed. Global climate change is altering the ice cycle (yearly coverage, depth, and persistence) in the Bering Sea and weather patterns. Changes in the ice affect the way local native groups are able to hunt for food, and maintain their community.
This presentation aims to increase the students’ knowledge about environmental epidemiology, by …
This presentation aims to increase the students’ knowledge about environmental epidemiology, by introducing different study designs used to study health effects of exposure to outdoor air pollution. All study designs are illustrated by examples, starting with the Great Smog (Killer Fog) of London in 1952, one of the landmarks in environmental epidemiology.
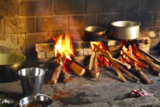
Nearly one third of the world’s population are exposed to high levels …
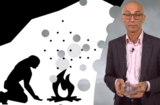
Nearly one third of the world’s population are exposed to high levels of indoor air pollution from the household’s use of solid fuel. The fuel is mainly biomass burning under poor combustion conditions in open fires or primitive stoves and with low ventilation. This costs more than 4 million lives every year and enormous suffering in particular among women and children.
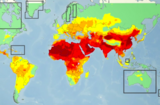
In this presentation, we will describe the global levels and trends in …
In this presentation, we will describe the global levels and trends in major air pollutants and related health burden. Air pollution is an important global risk factor for disease. People who live in more polluted areas develop more often chronic and infectious disease and die prematurely as compared to people living in areas with low air pollution.
In large part of the World, people spend more than 90 percent …
In large part of the World, people spend more than 90 percent of the time in indoor environments, where air quality is important for health. The environment outside the building, what goes on inside the building and the exchange of air pollutants affects the indoor air. Tight buildings can reduce energy consumption and entry of outdoor air pollutants, but unless ventilation is right indoor air pollutants from combustion processes, dampness, microbes, the dwellers bio effluents, appliances, care and cleaning products, clothing, furniture, building materials, the underground and many other sources will build up indoors causing important health effects.
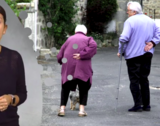
In this presentation, we will discuss how we can know whether one …
In this presentation, we will discuss how we can know whether one individual is more susceptible to harmful effect of air pollution than others are. Everyone is exposed, but some groups may be more susceptible to the harmful effect of air pollution than others may.
In this lecture, we will describe the mechanisms by which air pollution …
In this lecture, we will describe the mechanisms by which air pollution causes pulmonary health effects in the human population. The pulmonary health effects include exacerbation of asthma and chronic obstructive pulmonary diseases (COPD), increased risk of lower respiratory tracts infections and lung cancer.
In this presentation, we will describe the mechanisms by which air pollution …
In this presentation, we will describe the mechanisms by which air pollution causes health effects in other parts of the body than the lungs. In continuation of this, we will discuss the important mechanisms of extra pulmonary health effect.
There is a long way before the whole world complies with the …
There is a long way before the whole world complies with the WHO guidelines for air quality, but the enormous burden of disease from outdoor air pollution forces us to increase action to come as far as possible. In continuation of this, we will discuss what we can do about air pollution at global, international, national, city and individual levels. Most of the actions to reduce air pollution also mitigates climate change and/or promote health in other ways – so there are many win-win and win-win-win situations
This short, time-lapse video shows the changes in the Columbia Glacier from …
This short, time-lapse video shows the changes in the Columbia Glacier from May 12, 2007 to August 20, 2010. Narration provides general description of the geophysical dynamics and processes.
In this Interactive Lecture Demonstration, students will predict the main issues that …
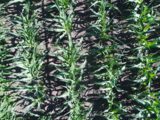
In this Interactive Lecture Demonstration, students will predict the main issues that might be included in short French language videos treating topics such as endangered species, organic farming, the effect of aerosols on the environment, pollution and sustainable development. They will then view short videos on the topics and reflect on how their prior assumptions meshed with reality.
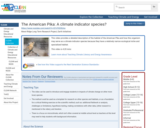
This video provides a detailed description of the habitat of the American …
This video provides a detailed description of the habitat of the American Pika and how this organism may serve as a climate indicator species because they have a relatively narrow ecological niche and specialized habitat.
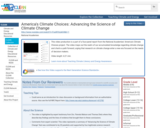
This video production is a part of a four-panel report from the …
This video production is a part of a four-panel report from the National Academies' America's Climate Choices project. The video maps out the realm of our accumulated knowledge regarding climate change and charts a path forward, urging that research on climate change enter a new era focused on the needs of decision makers.
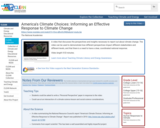
A video that discusses the perspectives and insights necessary to report out …
A video that discusses the perspectives and insights necessary to report out about climate change. The video can be used to demonstrate how different perspectives impact different stakeholders and different levels, and that there is a need to have a clear, coordinated national response.
This is a laboratory course supplemented by lectures that focus on selected …
This is a laboratory course supplemented by lectures that focus on selected analytical facilities that are commonly used to determine the mineralogy, elemental abundance and isotopic ratios of Sr and Pb in rocks, soils, sediments and water.
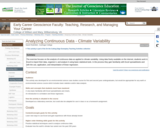
The activity is divided into seven parts, as follows: Part A: students …
The activity is divided into seven parts, as follows:
Part A: students access an online data set of historic global temperature anomalies and use the webpage to answer questions about the source and presentation of the data. Part B: students copy the data into an Excel spreadsheet and organize it so that it is easy for them to use and for others to follow. Part C: students graph their data, explore the use of trend lines, and use a linear regression line to predict future temperatures. Part D: students access an online data set of historic temperature anomalies within their latitude zone, analyze this data, and compare their results to those from Part C. Part E: students access an online data set of historic temperatures for their state, analyze this data, and compare their results to those from Parts C and D. Part F: students choose two original questions related to climate variability and use these or other data sets to address their questions. Part G: students evaluate the statistical significance of their linear regression lines and interpret their results in the context of climate variability
(Note: this resource was added to OER Commons as part of a batch upload of over 2,200 records. If you notice an issue with the quality of the metadata, please let us know by using the 'report' button and we will flag it for consideration.)
This activity covers the causes, effects, and mitigation of urban heat in …
This activity covers the causes, effects, and mitigation of urban heat in New York City. Students use data sets, graphs, maps and images to create their own plan for mitigation in their area. Robust satellite images, city data, tables, maps, and graphs are included in the resource for students to explore.
No restrictions on your remixing, redistributing, or making derivative works. Give credit to the author, as required.
Your remixing, redistributing, or making derivatives works comes with some restrictions, including how it is shared.
Your redistributing comes with some restrictions. Do not remix or make derivative works.
Most restrictive license type. Prohibits most uses, sharing, and any changes.
Copyrighted materials, available under Fair Use and the TEACH Act for US-based educators, or other custom arrangements. Go to the resource provider to see their individual restrictions.