Students connect percent to proportional relationships in the context of sales tax.Key …
Students connect percent to proportional relationships in the context of sales tax.Key ConceptsWhen there is a constant tax percent, the total cost for items purchase—including the price and the tax—is proportional to the price.To find the cost, c , multiply the price of the item, p, by (1 + t), where t is the tax percent, written as a decimal: c = p(1 + t).The constant of proportionality is (1 + t) because of the structure of the situation:c = p + tp = p(1 + t).Because of the distributive property, multiplying the price by (1 + t) means multiplying the price by 1, then multiplying the price by t, and then taking the sum of these products.Goals and Learning ObjectivesFind the total cost in a sales tax situation.Understand that a proportional relationship only exists between the price of an item and the total cost of the item if the sales tax is constant.Find the constant of proportionality in a sales tax situation.Make a graph of an equation showing the relationship between the price of an item and the total amount paid.
Students create equations, tables, and graphs to show the proportional relationships in …
Students create equations, tables, and graphs to show the proportional relationships in sales tax situations.Key ConceptsThe quantities—price, tax, and total cost—can each be known or unknown in a given situation, but if you know two quantities, you can figure out the missing quantity using the structure of the relationship among them.If either the price or the total cost are unknown, you can write an equation of the form y = kx, with k as the known value (1 + tax), and solve for x or y.If the tax is the unknown value, you can write an equation of the form y = kx and solve for k, and then subtract 1 from this value to find the tax (as a decimal value).Building a general model for the relationship among all three quantities helps you sort out what you know and what you need to find out.Goals and Learning ObjectivesMake a table to organize known and unknown quantities in a sales tax problem.Write and solve an equation to find an unknown quantity in a sales tax problem.Make a graph to represent a table of values.Determine the unknown amount—either the price of an item, the amount of the sales tax, or the total cost—in a sales tax situation when given the other two amounts.
Lesson OverviewStudents calculate the constant of proportionality for a proportional relationship based …
Lesson OverviewStudents calculate the constant of proportionality for a proportional relationship based on a table of values and use it to write a formula that represents the proportional relationship.Key ConceptsIf two quantities are proportional to one another, the relationship between them can be defined by a formula of the form y = kx, where k is the constant ratio of y-values to corresponding x-values. The same relationship can also be defined by the formula x=(1k)y , where 1k is now the constant ratio of x-values to y-values.Goals and Learning ObjectivesDefine the constant of proportionality.Calculate the constant of proportionality from a table of values.Write a formula using the constant of proportionality.
Students are asked whether they can determine the number of books in …
Students are asked whether they can determine the number of books in a stack by measuring the height of the stack, or the number of marbles in a collection of marbles by weighing the collection.Students are asked to identify for which situations they can determine the number of books in a stack of books by measuring the height of the stack or the number of marbles in a collection of marbles by weighing the collection.Key ConceptsAs students examine different numerical relationships, they come to understand that they can find the number of books or the number of marbles in situations in which the books are all the same thickness and the marbles are all the same weight. This “constant” is equal to the value BA for a ratio A : B; students begin to develop an intuitive understanding of proportional relationships.Goals and Learning ObjectivesExplore numerical relationshipsSWD: Some students with disabilities will benefit from a preview of the goals in each lesson. Have students highlight the critical features or concepts to help them pay close attention to salient information.
Students write the relationship between two fractions as a unit rate and …
Students write the relationship between two fractions as a unit rate and use unit rates and the constant of proportionality to solve problems involving proportional relationships.Key ConceptsIn situations where there is a constant rate involved, the unit rate is a constant of proportionality between the two variable quantities and can be used to write a formula of the form y = kx.A given constant rate can be simplified to find the unit rate by expressing its value with a denominator of 1.The ratios of two fractions can be expressed as a unit rate.Goals and Learning ObjectivesExpress the ratios of two fractions as a unit rate.Understand that when a constant rate is involved, the unit rate is the constant of proportionality.Use the unit rate to write and solve a formula of the form y = kx.
Students look at the relationship between the number of flags manufactured and …
Students look at the relationship between the number of flags manufactured and the stars on the flag and determine whether it represents a proportional relationship.Key ConceptsThe form of the equation of a proportional relation is y = kx, where k is the constant of proportionality.A graph of a proportional relationship is a straight line that passes through the origin.The constant of a proportionality in a graph of a proportional relationship is the constant ratio of y to x (the slope of the line).Goals and Learning ObjectivesIdentify the constant of proportionality in a proportional relationship based on a real-world problem situation.Write a formula using the constant of proportionality.Analyze a graph of a proportional relationship.Make a graph and determine if it represents a proportional relationship.Identify the constant of proportionality in a graph of a proportional relationship.
Students explore the idea that not all straight lines are proportional by …
Students explore the idea that not all straight lines are proportional by comparing a graph representing a stack of books with a graph representing a stack of cups. They recognize that all proportional relationships are represented as a straight line that passes through the origin.Key ConceptsNot all graphs of straight lines represent proportional relationships.There are three ways to tell whether a relationship between two varying quantities is proportional:The graph of the relationship between the quantities is a straight line that passes through the point (0, 0).You can express one quantity in terms of the other using a formula of the form y = kx.The ratios between the varying quantities are constant.Goals and Learning ObjectivesUnderstand when a graph of a straight line is and when it is not a proportional relationship.Recognize that a proportional relationship is shown on a graph as a straight line that passes through the origin (0, 0).Make a table of values to represent two quantities that vary.Graph a table of values representing two quantities that vary.Describe what each variable and number in a formula represents.
Students determine whether a relationship between two quantities that vary is a …
Students determine whether a relationship between two quantities that vary is a proportional relationship in three different situations: the relationship between the dimensions of the actual Empire State Building and a miniature model of the building; the relationship between the distance and time to travel to an amusement park; and the relationship between time and temperature at an amusement park.Key ConceptsWhen the ratio between two varying quantities remains constant, the relationship between the two quantities is called a proportional relationship. For a ratio A:B, the proportional relationship can be described as the collection of ratios equivalent to A:B, or cA:cB, where c is positive.Goals and Learning ObjectivesIdentify proportional relationships.Explain why a situation represents a proportional relationship or why it does not.Determine missing values in a table of quantities based on a proportional relationship.
Students interpret verbal descriptions of situations and determine whether the situations represent …
Students interpret verbal descriptions of situations and determine whether the situations represent proportional relationships.Key ConceptsIn a proportional relationship, there has to be some value that is constant.There are some relationships in some situations that can never be proportional.Goals and Learning ObjectivesIdentify verbal descriptions of situations as being proportional relationships or notUnderstand that some relationships can never be proportionalUnderstand that for two variable quantities to be proportional to one another, something in the situation has to be constant
Students represent and solve percent decrease problems.Key ConceptsWhen there is a percent …
Students represent and solve percent decrease problems.Key ConceptsWhen there is a percent decrease between a starting amount and a final amount, the relationship can be represented by an equation of the form y = kx where y is the final amount, x is the starting amount, and k is the constant of proportionality, which is equal to 1 minus the percent change, p, represented as a decimal: k = 1 – p, so y = (1 – p)x.The constant of proportionality k has the value it does—a number less than 1—because of the way the distributive property can be used to simplify the expression for the starting amount decreased by a percent of the starting amount: x – x(p) = x(1 – p).Goals and Learning ObjectivesDetermine the unknown amount—either the starting amount, the percent change, or the final amount—in a percent decrease situation when given the other two amounts.Make a table to represent a percent decrease problem.Write and solve an equation to represent a percent decrease problem.
Students represent and solve percent increase problems.Key ConceptsWhen there is a percent …
Students represent and solve percent increase problems.Key ConceptsWhen there is a percent increase between a starting amount and a final amount, the relationship can be represented by an equation of the form y = kx where y is the final amount, x is the starting amount, and k is the constant of proportionality, which is equal to 1 plus the percent change, p, represented as a decimal: k = 1 + p, so y = (1 + p)x.The constant of proportionality k has the value it does—a number greater than 1—because of the way the distributive property can be used to simplify the expression for the starting amount increased by a percent of the starting amount: x + x(p) = x(1 + p).Goals and Learning ObjectivesDetermine the unknown amount—either the starting amount, the percent change, or the final amount—in a percent increase situation when given the other two amounts.Make a table to represent a percent increase problem.Write and solve an equation to represent a percent increase problem.
Students continue to explore the three relationships from the previous lessons: Comparing …
Students continue to explore the three relationships from the previous lessons: Comparing Dimensions, Driving to the Amusement Park, and Temperatures at the Amusement Park. They graph the three situations and realize that the two proportional relationships form a straight line, but the time and temperature relationship does not.Key ConceptsA table of values that represent equivalent ratios can be graphed in the coordinate plane. The graph represents a proportional relationship in the form of a straight line that passes through the origin (0, 0). The unit rate is the slope of the line.Goals and Learning ObjectivesRepresent relationships shown in a table of values as a graph.Recognize that a proportional relationship is shown on a graph as a straight line that passes through the origin (0, 0).
Students have an opportunity to review their own work on the Self …
Students have an opportunity to review their own work on the Self Check in the previous lesson, consider feedback that addresses specific aspects of their work, examine a different approach to the problem from the Self Check, and then use what they learned to solve a closely related problem.Key ConceptsStudents reflect on their work, review and critique student work on the same problem, and then apply their learning to solve a similar problem.Goals and Learning ObjectivesUse teacher comments to refine their solution strategies for a proportional relationship problemDeepen their understanding of proportional relationships.Synthesize and connect strategies for representing and investigating proportional relationships.Critique given student work involving proportional relationships.Apply deepened understanding of proportional relationships to a new problem situation.
Students watch a video showing three different ways to solve a problem …
Students watch a video showing three different ways to solve a problem involving a proportional relationship, and then they use each method to solve a similar problem. Students describe each approach, including the mathematical terms associated with each.Key ConceptsThree methods for solving problems involving proportional relationships include:Setting up a proportion and solving for the missing valueFinding the unit rate and multiplyingWriting and solving a formula using the constant of proportionalityGoals and Learning ObjectivesSolve a problem involving a proportional relationship in three different ways: set up a proportion and solve for a missing value, use a unit rate, and use the constant of proportionality to write and solve a formula.
The intent of clarifying statements is to provide additional guidance for educators …
The intent of clarifying statements is to provide additional guidance for educators to communicate the intent of the standard to support the future development of curricular resources and assessments aligned to the 2021 math standards. Clarifying statements can be in the form of succinct sentences or paragraphs that attend to one of four types of clarifications: (1) Student Experiences; (2) Examples; (3) Boundaries; and (4) Connection to Math Practices.
Students work in engineering teams to optimize cleaner energy solutions for cooking …
Students work in engineering teams to optimize cleaner energy solutions for cooking and heating in rural China. They choose between various options for heating, cooking, hot water, and lights and other electricity, balancing between the cost and health effects of different energy choices.
This lesson unit is intended to help teachers assess whether students are …
This lesson unit is intended to help teachers assess whether students are able to: identify when two quantities vary in direct proportion to each other; distinguish between direct proportion and other functional relationships; and solve proportionality problems using efficient methods.
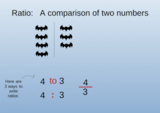
The battle is on in this game where you build your own …
The battle is on in this game where you build your own potions! Check your ratios to win this mixture mix-off. Ratio Rumble guides students in: identifying ratios when used in a variety of contextual situations; providing visual representations of ratios; solving common problems or communicating by using rate, particularly unit rates; and explaining why ratios and rates naturally relate to fractions and decimals.
No restrictions on your remixing, redistributing, or making derivative works. Give credit to the author, as required.
Your remixing, redistributing, or making derivatives works comes with some restrictions, including how it is shared.
Your redistributing comes with some restrictions. Do not remix or make derivative works.
Most restrictive license type. Prohibits most uses, sharing, and any changes.
Copyrighted materials, available under Fair Use and the TEACH Act for US-based educators, or other custom arrangements. Go to the resource provider to see their individual restrictions.