A full AP® Statistics curriculum that explores relevant data in social issues, …
A full AP® Statistics curriculum that explores relevant data in social issues, economics, medicine, sports, and more. The sequence works well in conjunction with the course CED and the most widely-used AP® Statistics textbooks.
Module 2 builds on students' previous work with units and with functions …
Module 2 builds on students' previous work with units and with functions from Algebra I, and with trigonometric ratios and circles from high school Geometry. The heart of the module is the study of precise definitions of sine and cosine (as well as tangent and the co-functions) using transformational geometry from high school Geometry. This precision leads to a discussion of a mathematically natural unit of rotational measure, a radian, and students begin to build fluency with the values of the trigonometric functions in terms of radians. Students graph sinusoidal and other trigonometric functions, and use the graphs to help in modeling and discovering properties of trigonometric functions. The study of the properties culminates in the proof of the Pythagorean identity and other trigonometric identities.
Find the rest of the EngageNY Mathematics resources at https://archive.org/details/engageny-mathematics.
A statistics lesson on describing and making claims from data representations, specifically …
A statistics lesson on describing and making claims from data representations, specifically linearly increasing data. Applies ideas of rate-of-change to develop writing a linear equation to fit the data, using the equation to interpolate and extrapolate additional information, and integrating the mathematical interpretation appropriately into a social sciences argument.
Students investigate the property dependence between concentrations and boiling point. In section …
Students investigate the property dependence between concentrations and boiling point. In section 1, students first investigate the boiling point of various liquid solutions. In section 2, they analyze data collected by the entire class to generate two boiling point curves, one for salt solutions and one for sugar solutions. Finally, in section 3, students use the data they have analyzed to determine how to create a solution that has a particular boiling point and is a cost-effective design.
This lesson unit is intended to help teachers assess how well students …
This lesson unit is intended to help teachers assess how well students understand the notion of correlation. In particular this unit aims to identify and help students who have difficulty in: understanding correlation as the degree of fit between two variables; making a mathematical model of a situation; testing and improving the model; communicating their reasoning clearly; and evaluating alternative models of the situation.
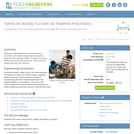
Working as engineering teams in this introductory pneumatics lab, students design and …
Working as engineering teams in this introductory pneumatics lab, students design and build working pneumatic (air-powered) systems. The goal is to create systems that launch balls into the air. They record and analyze data from their launches.
This lesson unit is intended to help teachers assess how well students …
This lesson unit is intended to help teachers assess how well students are able to: interpret data and evaluate statistical summaries; and critique someone elseŐs interpretations of data and evaluations of statistical summaries. The lesson also introduces students to the dangers of misapplying simple statistics in real-world contexts, and illustrates some of the common abuses of statistics and charts found in the media.
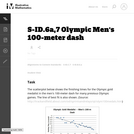
This is a task from the Illustrative Mathematics website that is one …
This is a task from the Illustrative Mathematics website that is one part of a complete illustration of the standard to which it is aligned. Each task has at least one solution and some commentary that addresses important asects of the task and its potential use. Here are the first few lines of the commentary for this task: The scatterplot below shows the finishing times for the Olympic gold medalist in the men's 100-meter dash for many previous Olympic games. The least sq...
(Nota: Esta es una traducción de un recurso educativo abierto creado por …
(Nota: Esta es una traducción de un recurso educativo abierto creado por el Departamento de Educación del Estado de Nueva York (NYSED) como parte del proyecto "EngageNY" en 2013. Aunque el recurso real fue traducido por personas, la siguiente descripción se tradujo del inglés original usando Google Translate para ayudar a los usuarios potenciales a decidir si se adapta a sus necesidades y puede contener errores gramaticales o lingüísticos. La descripción original en inglés también se proporciona a continuación.)
El módulo 2 se basa en el trabajo previo de los estudiantes con unidades y con funciones del álgebra I, y con relaciones y círculos trigonométricos de la geometría de la escuela secundaria. El corazón del módulo es el estudio de definiciones precisas de seno y coseno (así como tangente y las cofunciones) utilizando geometría transformacional de la geometría de la escuela secundaria. Esta precisión lleva a una discusión de una unidad matemáticamente natural de medida rotacional, un radian, y los estudiantes comienzan a desarrollar fluidez con los valores de las funciones trigonométricas en términos de radianes. Los estudiantes grafican funciones trigonométricas sinusoidales y otras, y usan los gráficos para ayudar a modelar y descubrir propiedades de las funciones trigonométricas. El estudio de las propiedades culmina en la prueba de la identidad pitagórica y otras identidades trigonométricas.
Encuentre el resto de los recursos matemáticos de Engageny en https://archive.org/details/engageny-mathematics.
English Description: Module 2 builds on students' previous work with units and with functions from Algebra I, and with trigonometric ratios and circles from high school Geometry. The heart of the module is the study of precise definitions of sine and cosine (as well as tangent and the co-functions) using transformational geometry from high school Geometry. This precision leads to a discussion of a mathematically natural unit of rotational measure, a radian, and students begin to build fluency with the values of the trigonometric functions in terms of radians. Students graph sinusoidal and other trigonometric functions, and use the graphs to help in modeling and discovering properties of trigonometric functions. The study of the properties culminates in the proof of the Pythagorean identity and other trigonometric identities.
Find the rest of the EngageNY Mathematics resources at https://archive.org/details/engageny-mathematics.
No restrictions on your remixing, redistributing, or making derivative works. Give credit to the author, as required.
Your remixing, redistributing, or making derivatives works comes with some restrictions, including how it is shared.
Your redistributing comes with some restrictions. Do not remix or make derivative works.
Most restrictive license type. Prohibits most uses, sharing, and any changes.
Copyrighted materials, available under Fair Use and the TEACH Act for US-based educators, or other custom arrangements. Go to the resource provider to see their individual restrictions.