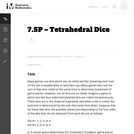
This is a task from the Illustrative Mathematics website that is one …
This is a task from the Illustrative Mathematics website that is one part of a complete illustration of the standard to which it is aligned. Each task has at least one solution and some commentary that addresses important asects of the task and its potential use. Here are the first few lines of the commentary for this task: Many games use dice which are six-sided and fair (meaning each face on the die is equally likely to land face up). Many games also use the sum of two d...
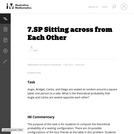
This is a task from the Illustrative Mathematics website that is one …
This is a task from the Illustrative Mathematics website that is one part of a complete illustration of the standard to which it is aligned. Each task has at least one solution and some commentary that addresses important asects of the task and its potential use. Here are the first few lines of the commentary for this task: Angie, Bridget, Carlos, and Diego are seated at random around a square table, one person to a side. What is the theoretical probability that Angie and ...
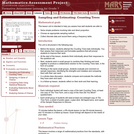
This lesson unit is intended to help you assess how well students …
This lesson unit is intended to help you assess how well students are able to: solve simple problems involving ratio and direct proportion; choose an appropriate sampling method; and collect discrete data and record them using a frequency table.
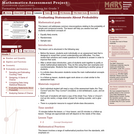
This lesson unit addresses common misconceptions relating to probability of simple and …
This lesson unit addresses common misconceptions relating to probability of simple and compound events. The lesson will help you assess how well students understand concepts of: Equally likely events; randomness; and sample sizes.
Four full-year digital course, built from the ground up and fully-aligned to …
Four full-year digital course, built from the ground up and fully-aligned to the Common Core State Standards, for 7th grade Mathematics. Created using research-based approaches to teaching and learning, the Open Access Common Core Course for Mathematics is designed with student-centered learning in mind, including activities for students to develop valuable 21st century skills and academic mindset.
Students design and work on their projects in class. They review the …
Students design and work on their projects in class. They review the project rubric and, as a class, add criteria relevant to their specific projects.Key ConceptsStudents are expected to use the mathematical skills they have acquired in previous lessons or in previous math courses. The lessons in this unit focus on developing and refining problem-solving skills.Students will:Try a variety of strategies to approaching different types of problems.Devise a problem-solving plan and implement their plan systematically.Become aware that problems can be solved in more than one way.See the value of approaching problems in a systematic manner.Communicate their approaches with precision and articulate why their strategies and solutions are reasonable.Make connections between previous learning and real-world problems.Create efficacy and confidence in solving challenging problems in a real-world setting.Goals and Learning ObjectivesCreate and implement a problem-solving plan.Organize and interpret data presented in a problem situation.Use multiple representations—including tables, graphs, and equations—to organize and communicate data.Articulate strategies, thought processes, and approaches to solving a problem and defend why the solution is reasonable.
Samples and ProbabilityType of Unit: ConceptualPrior KnowledgeStudents should be able to:Understand the …
Samples and ProbabilityType of Unit: ConceptualPrior KnowledgeStudents should be able to:Understand the concept of a ratio.Write ratios as percents.Describe data using measures of center.Display and interpret data in dot plots, histograms, and box plots.Lesson FlowStudents begin to think about probability by considering the relative likelihood of familiar events on the continuum between impossible and certain. Students begin to formalize this understanding of probability. They are introduced to the concept of probability as a measure of likelihood, and how to calculate probability of equally likely events using a ratio. The terms (impossible, certain, etc.) are given numerical values. Next, students compare expected results to actual results by calculating the probability of an event and conducting an experiment. Students explore the probability of outcomes that are not equally likely. They collect data to estimate the experimental probabilities. They use ratio and proportion to predict results for a large number of trials. Students learn about compound events. They use tree diagrams, tables, and systematic lists as tools to find the sample space. They determine the theoretical probability of first independent, and then dependent events. In Lesson 10 students identify a question to investigate for a unit project and submit a proposal. They then complete a Self Check. In Lesson 11, students review the results of the Self Check, solve a related problem, and take a Quiz.Students are introduced to the concept of sampling as a method of determining characteristics of a population. They consider how a sample can be random or biased, and think about methods for randomly sampling a population to ensure that it is representative. In Lesson 13, students collect and analyze data for their unit project. Students begin to apply their knowledge of statistics learned in sixth grade. They determine the typical class score from a sample of the population, and reason about the representativeness of the sample. Then, students begin to develop intuition about appropriate sample size by conducting an experiment. They compare different sample sizes, and decide whether increasing the sample size improves the results. In Lesson 16 and Lesson 17, students compare two data sets using any tools they wish. Students will be reminded of Mean Average Deviation (MAD), which will be a useful tool in this situation. Students complete another Self Check, review the results of their Self Check, and solve additional problems. The unit ends with three days for students to work on Gallery problems, possibly using one of the days to complete their project or get help on their project if needed, two days for students to present their unit projects to the class, and one day for the End of Unit Assessment.
Students extend their understanding of compound events. They will compare experimental results …
Students extend their understanding of compound events. They will compare experimental results to predicted results by calculating the probability of an event, then conducting an experiment.Key ConceptsStudents apply their understanding of compound events to actual experiments.Students will see there is variability in actual results.Goals and Learning ObjectivesContinue to explore compound independent events.Compare theoretical probability to experimental probability.
Students begin learning about compound events by considering independent events. They will …
Students begin learning about compound events by considering independent events. They will consider everyday objects with known probabilities. Students will represent sample spaces using lists, tables, and tree diagrams in order to calculate the probability of certain events.Key ConceptsCompound events are introduced in this lesson, building upon what students have learned about determining sample space and probabilities of single events.Terms introduced are:multistage experiment: an experiment in which more than one action is performedcompound events: the combined results of multistage experimentsindependent events: compound events in which the outcome of one does not affect the outcome of the otherGoals and Learning ObjectivesLearn about compound events and sample spaces.Use different tools to find the sample space (tree diagrams, tables, lists) of a compound event.Use ratio and proportion to solve problems.SWD: Go over the mathematical language used throughout the module. Make sure students use that language when discussing problems in this lesson.
Students will continue to apply their understanding of compound independent events. They …
Students will continue to apply their understanding of compound independent events. They will calculate probabilities and represent sample spaces with visual representations.Key ConceptsStudents continue to solve problems with compound events. The formula for calculating the probability of independent events is introduced:P(A and B) = P(A) ⋅ P(B)Goals and Learning ObjectivesDeepen understanding of compound events using lists, tables, and tree diagrams.Learn about the Fundamental Counting Principle.
Students continue to extend their understanding of compound events by comparing independent …
Students continue to extend their understanding of compound events by comparing independent and dependent events. This includes drawing the sample space to understand how the first event does or does not affect the second event. Students will solve problems with dependent compound events.Key ConceptsStudents will learn about the differences between dependent and independent events.Events are independent if the outcome of an event does not influence the outcome of the others.Events are dependent if the outcome of an event does influence the outcome of the others.The difference can be observed by drawing a diagram to represent the sample space. For dependent events, the sample space is smaller.Goals and Learning ObjectivesUnderstand the difference between independent and dependent compound events.Draw diagrams for dependent compound events.Solve compound event problems.
Students critique and improve their work on the Self Check, then work …
Students critique and improve their work on the Self Check, then work on additional problems.Key ConceptsStudents apply what they have learned to date to solve the problems in this lesson.Goals and Learning ObjectivesApply knowledge of probability to solve problems.Determine theoretical probability.Predict expected results.
No restrictions on your remixing, redistributing, or making derivative works. Give credit to the author, as required.
Your remixing, redistributing, or making derivatives works comes with some restrictions, including how it is shared.
Your redistributing comes with some restrictions. Do not remix or make derivative works.
Most restrictive license type. Prohibits most uses, sharing, and any changes.
Copyrighted materials, available under Fair Use and the TEACH Act for US-based educators, or other custom arrangements. Go to the resource provider to see their individual restrictions.