The "Renaissance" as a phenomenon in European history is best understood as …
The "Renaissance" as a phenomenon in European history is best understood as a series of social, political, and cultural responses to an intellectual trend which began in Italy in the fourteenth century. This intellectual tendency, known as humanism, or the studia humanitatis, was at the heart of developments in literature, the arts, the sciences, religion, and government for almost three hundred years. In this class, we will highlight the history of humanism, but we will also study religious reformations, high politics, the agrarian world, and European conquest and expansion abroad in the period.
Statistical table of attitudes towards the honesty and ethical standards of judges …
Statistical table of attitudes towards the honesty and ethical standards of judges organized by demographic characteristics. Lower income earners and elderly citizens tend to rate judges lower.
TED Studies, created in collaboration with Wiley, are curated video collections …
TED Studies, created in collaboration with Wiley, are curated video collections supplemented by rich educational materials for students, educators and self-guided learners. In Visualizing Data, TED speakers shake up statistics with elegant, dynamic representations that make mountains of data comprehensible and even exciting. Learn how to visualize data and present complicated statistics in elegant and captivating ways. Relevant areas of interest, study and coursework include: information design, demography, statistical literacy, economics, sociology, media studies, linguistics, meteorology and computer science.
This is a learning module that uses data to investigate the relationships …
This is a learning module that uses data to investigate the relationships between voter turnout and demographic characteristics such as race, age, income and education.
William Edward Burghardt “W. E. B.” Du Bois — sociologist, historian, activist, …
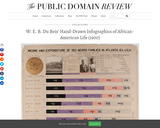
William Edward Burghardt “W. E. B.” Du Bois — sociologist, historian, activist, Pan-Africanist, and prolific author — had also, it turns out, a mighty fine eye for graphic design. Born in Great Barrington, Massachusetts in 1868, Du Bois studied at Fisk University, Humboldt University in Berlin, and Harvard (where he was the first African American to earn a doctorate), and in 1897 he became a professor of history, sociology and economics at Atlanta University. Two years later he published his first major academic work The Philadelphia Negro (1899), a detailed and comprehensive sociological study of the African-American people of Philadelphia, based on his earlier field work. The following year, along with collaborators Thomas J. Calloway and Daniel Murray, Du Bois travelled to Europe, firstly to the First Pan-African Conference held in London, and then to the Paris Exposition to present a groundbreaking exhibition on the state of African-American life — “The Exhibit of American Negroes” — which, according to Du Bois, attempted to show “(a) The history of the American Negro. (b) His present condition. (c) His education. (d) His literature.”
In addition to an extensive collection of photographs, four volumes containing 400 official patents by African Americans, more than 200 books penned by African-American authors, various maps, and a statuette of Frederick Douglass, the exhibition featured a total of fifty-eight stunning hand-drawn charts (a selection of which we present below). Created by Du Bois and his students at Atlanta, the charts, many of which focus on economic life in Georgia, managed to condense an enormous amount of data into a set of aesthetically daring and easily digestible visualisations. As Alison Meier notes in Hyperallergic, “they’re strikingly vibrant and modern, almost anticipating the crossing lines of Piet Mondrian or the intersecting shapes of Wassily Kandinsky”.
No restrictions on your remixing, redistributing, or making derivative works. Give credit to the author, as required.
Your remixing, redistributing, or making derivatives works comes with some restrictions, including how it is shared.
Your redistributing comes with some restrictions. Do not remix or make derivative works.
Most restrictive license type. Prohibits most uses, sharing, and any changes.
Copyrighted materials, available under Fair Use and the TEACH Act for US-based educators, or other custom arrangements. Go to the resource provider to see their individual restrictions.