Data Carpentry lesson from Ecology curriculum to learn how to analyse and …
Data Carpentry lesson from Ecology curriculum to learn how to analyse and visualise ecological data in R. Data Carpentry’s aim is to teach researchers basic concepts, skills, and tools for working with data so that they can get more done in less time, and with less pain. The lessons below were designed for those interested in working with ecology data in R. This is an introduction to R designed for participants with no programming experience. These lessons can be taught in a day (~ 6 hours). They start with some basic information about R syntax, the RStudio interface, and move through how to import CSV files, the structure of data frames, how to deal with factors, how to add/remove rows and columns, how to calculate summary statistics from a data frame, and a brief introduction to plotting. The last lesson demonstrates how to work with databases directly from R.
Data Carpentry lesson to learn how to use command-line tools to perform …
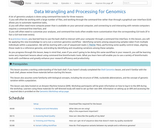
Data Carpentry lesson to learn how to use command-line tools to perform quality control, align reads to a reference genome, and identify and visualize between-sample variation. A lot of genomics analysis is done using command-line tools for three reasons: 1) you will often be working with a large number of files, and working through the command-line rather than through a graphical user interface (GUI) allows you to automate repetitive tasks, 2) you will often need more compute power than is available on your personal computer, and connecting to and interacting with remote computers requires a command-line interface, and 3) you will often need to customize your analyses, and command-line tools often enable more customization than the corresponding GUI tools (if in fact a GUI tool even exists). In a previous lesson, you learned how to use the bash shell to interact with your computer through a command line interface. In this lesson, you will be applying this new knowledge to carry out a common genomics workflow - identifying variants among sequencing samples taken from multiple individuals within a population. We will be starting with a set of sequenced reads (.fastq files), performing some quality control steps, aligning those reads to a reference genome, and ending by identifying and visualizing variations among these samples. As you progress through this lesson, keep in mind that, even if you aren’t going to be doing this same workflow in your research, you will be learning some very important lessons about using command-line bioinformatic tools. What you learn here will enable you to use a variety of bioinformatic tools with confidence and greatly enhance your research efficiency and productivity.
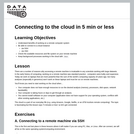
Data Carpentry lesson to learn how to work with Amazon AWS cloud …
Data Carpentry lesson to learn how to work with Amazon AWS cloud computing and how to transfer data between your local computer and cloud resources. The cloud is a fancy name for the huge network of computers that host your favorite websites, stream movies, and shop online, but you can also harness all of that computing power for running analyses that would take days, weeks or even years on your local computer. In this lesson, you’ll learn about renting cloud services that fit your analytic needs, and how to interact with one of those services (AWS) via the command line.
Data Carpentry lesson to learn to navigate your file system, create, copy, …
Data Carpentry lesson to learn to navigate your file system, create, copy, move, and remove files and directories, and automate repetitive tasks using scripts and wildcards with genomics data. Command line interface (OS shell) and graphic user interface (GUI) are different ways of interacting with a computer’s operating system. The shell is a program that presents a command line interface which allows you to control your computer using commands entered with a keyboard instead of controlling graphical user interfaces (GUIs) with a mouse/keyboard combination. There are quite a few reasons to start learning about the shell: For most bioinformatics tools, you have to use the shell. There is no graphical interface. If you want to work in metagenomics or genomics you’re going to need to use the shell. The shell gives you power. The command line gives you the power to do your work more efficiently and more quickly. When you need to do things tens to hundreds of times, knowing how to use the shell is transformative. To use remote computers or cloud computing, you need to use the shell.
No restrictions on your remixing, redistributing, or making derivative works. Give credit to the author, as required.
Your remixing, redistributing, or making derivatives works comes with some restrictions, including how it is shared.
Your redistributing comes with some restrictions. Do not remix or make derivative works.
Most restrictive license type. Prohibits most uses, sharing, and any changes.
Copyrighted materials, available under Fair Use and the TEACH Act for US-based educators, or other custom arrangements. Go to the resource provider to see their individual restrictions.