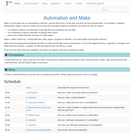
A Software Carpentry lesson to learn how to use Make Make is …
A Software Carpentry lesson to learn how to use Make Make is a tool which can run commands to read files, process these files in some way, and write out the processed files. For example, in software development, Make is used to compile source code into executable programs or libraries, but Make can also be used to: run analysis scripts on raw data files to get data files that summarize the raw data; run visualization scripts on data files to produce plots; and to parse and combine text files and plots to create papers. Make is called a build tool - it builds data files, plots, papers, programs or libraries. It can also update existing files if desired. Make tracks the dependencies between the files it creates and the files used to create these. If one of the original files (e.g. a data file) is changed, then Make knows to recreate, or update, the files that depend upon this file (e.g. a plot). There are now many build tools available, all of which are based on the same concepts as Make.
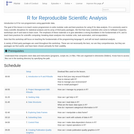
Data Carpentry lesson from Ecology curriculum to learn how to analyse and …
Data Carpentry lesson from Ecology curriculum to learn how to analyse and visualise ecological data in R. Data Carpentry’s aim is to teach researchers basic concepts, skills, and tools for working with data so that they can get more done in less time, and with less pain. The lessons below were designed for those interested in working with ecology data in R. This is an introduction to R designed for participants with no programming experience. These lessons can be taught in a day (~ 6 hours). They start with some basic information about R syntax, the RStudio interface, and move through how to import CSV files, the structure of data frames, how to deal with factors, how to add/remove rows and columns, how to calculate summary statistics from a data frame, and a brief introduction to plotting. The last lesson demonstrates how to work with databases directly from R.
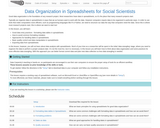
Lesson on spreadsheets for social scientists. Good data organization is the foundation …
Lesson on spreadsheets for social scientists. Good data organization is the foundation of any research project. Most researchers have data in spreadsheets, so it’s the place that many research projects start. Typically we organize data in spreadsheets in ways that we as humans want to work with the data. However computers require data to be organized in particular ways. In order to use tools that make computation more efficient, such as programming languages like R or Python, we need to structure our data the way that computers need the data. Since this is where most research projects start, this is where we want to start too! In this lesson, you will learn: Good data entry practices - formatting data tables in spreadsheets How to avoid common formatting mistakes Approaches for handling dates in spreadsheets Basic quality control and data manipulation in spreadsheets Exporting data from spreadsheets In this lesson, however, you will not learn about data analysis with spreadsheets. Much of your time as a researcher will be spent in the initial ‘data wrangling’ stage, where you need to organize the data to perform a proper analysis later. It’s not the most fun, but it is necessary. In this lesson you will learn how to think about data organization and some practices for more effective data wrangling. With this approach you can better format current data and plan new data collection so less data wrangling is needed.
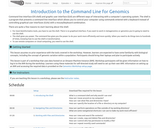
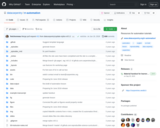
Data Carpentry lesson to learn how to use command-line tools to perform …
Data Carpentry lesson to learn how to use command-line tools to perform quality control, align reads to a reference genome, and identify and visualize between-sample variation. A lot of genomics analysis is done using command-line tools for three reasons: 1) you will often be working with a large number of files, and working through the command-line rather than through a graphical user interface (GUI) allows you to automate repetitive tasks, 2) you will often need more compute power than is available on your personal computer, and connecting to and interacting with remote computers requires a command-line interface, and 3) you will often need to customize your analyses, and command-line tools often enable more customization than the corresponding GUI tools (if in fact a GUI tool even exists). In a previous lesson, you learned how to use the bash shell to interact with your computer through a command line interface. In this lesson, you will be applying this new knowledge to carry out a common genomics workflow - identifying variants among sequencing samples taken from multiple individuals within a population. We will be starting with a set of sequenced reads (.fastq files), performing some quality control steps, aligning those reads to a reference genome, and ending by identifying and visualizing variations among these samples. As you progress through this lesson, keep in mind that, even if you aren’t going to be doing this same workflow in your research, you will be learning some very important lessons about using command-line bioinformatic tools. What you learn here will enable you to use a variety of bioinformatic tools with confidence and greatly enhance your research efficiency and productivity.
Software Carpentry lesson that teaches how to use databases and SQL In …
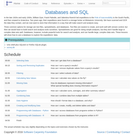
Software Carpentry lesson that teaches how to use databases and SQL In the late 1920s and early 1930s, William Dyer, Frank Pabodie, and Valentina Roerich led expeditions to the Pole of Inaccessibility in the South Pacific, and then onward to Antarctica. Two years ago, their expeditions were found in a storage locker at Miskatonic University. We have scanned and OCR the data they contain, and we now want to store that information in a way that will make search and analysis easy. Three common options for storage are text files, spreadsheets, and databases. Text files are easiest to create, and work well with version control, but then we would have to build search and analysis tools ourselves. Spreadsheets are good for doing simple analyses, but they don’t handle large or complex data sets well. Databases, however, include powerful tools for search and analysis, and can handle large, complex data sets. These lessons will show how to use a database to explore the expeditions’ data.
Workshop overview for the Data Carpentry genomics curriculum. Data Carpentry’s aim is …
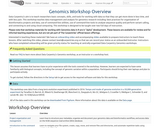
Workshop overview for the Data Carpentry genomics curriculum. Data Carpentry’s aim is to teach researchers basic concepts, skills, and tools for working with data so that they can get more done in less time, and with less pain. This workshop teaches data management and analysis for genomics research including: best practices for organization of bioinformatics projects and data, use of command-line utilities, use of command-line tools to analyze sequence quality and perform variant calling, and connecting to and using cloud computing. This workshop is designed to be taught over two full days of instruction. Please note that workshop materials for working with Genomics data in R are in “alpha” development. These lessons are available for review and for informal teaching experiences, but are not yet part of The Carpentries’ official lesson offerings. Interested in teaching these materials? We have an onboarding video and accompanying slides available to prepare Instructors to teach these lessons. After watching this video, please contact team@carpentries.org so that we can record your status as an onboarded Instructor. Instructors who have completed onboarding will be given priority status for teaching at centrally-organized Data Carpentry Genomics workshops.
Data Carpentry lesson to learn how to work with Amazon AWS cloud …
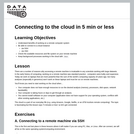
Data Carpentry lesson to learn how to work with Amazon AWS cloud computing and how to transfer data between your local computer and cloud resources. The cloud is a fancy name for the huge network of computers that host your favorite websites, stream movies, and shop online, but you can also harness all of that computing power for running analyses that would take days, weeks or even years on your local computer. In this lesson, you’ll learn about renting cloud services that fit your analytic needs, and how to interact with one of those services (AWS) via the command line.
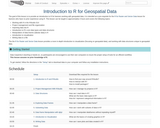
The goal of this lesson is to provide an introduction to R …
The goal of this lesson is to provide an introduction to R for learners working with geospatial data. It is intended as a pre-requisite for the R for Raster and Vector Data lesson for learners who have no prior experience using R. This lesson can be taught in approximately 4 hours and covers the following topics: Working with R in the RStudio GUI Project management and file organization Importing data into R Introduction to R’s core data types and data structures Manipulation of data frames (tabular data) in R Introduction to visualization Writing data to a file The the R for Raster and Vector Data lesson provides a more in-depth introduction to visualization (focusing on geospatial data), and working with data structures unique to geospatial data.
Data Carpentry lesson to learn to navigate your file system, create, copy, …
Data Carpentry lesson to learn to navigate your file system, create, copy, move, and remove files and directories, and automate repetitive tasks using scripts and wildcards with genomics data. Command line interface (OS shell) and graphic user interface (GUI) are different ways of interacting with a computer’s operating system. The shell is a program that presents a command line interface which allows you to control your computer using commands entered with a keyboard instead of controlling graphical user interfaces (GUIs) with a mouse/keyboard combination. There are quite a few reasons to start learning about the shell: For most bioinformatics tools, you have to use the shell. There is no graphical interface. If you want to work in metagenomics or genomics you’re going to need to use the shell. The shell gives you power. The command line gives you the power to do your work more efficiently and more quickly. When you need to do things tens to hundreds of times, knowing how to use the shell is transformative. To use remote computers or cloud computing, you need to use the shell.
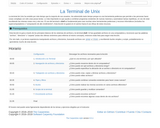
Software Carpentry lección para la terminal de Unix La terminal de Unix …
Software Carpentry lección para la terminal de Unix La terminal de Unix ha existido por más tiempo que la mayoría de sus usuarios. Ha sobrevivido tanto tiempo porque es una herramienta poderosa que permite a las personas hacer cosas complejas con sólo unas pocas teclas. Lo más importante es que ayuda a combinar programas existentes de nuevas maneras y automatizar tareas repetitivas, en vez de estar escribiendo las mismas cosas una y otra vez. El uso del terminal o shell es fundamental para usar muchas otras herramientas poderosas y recursos informáticos (incluidos los supercomputadores o “computación de alto rendimiento”). Esta lección te guiará en el camino hacia el uso eficaz de estos recursos.
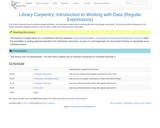
This Library Carpentry lesson introduces librarians and others to working with data. …
This Library Carpentry lesson introduces librarians and others to working with data. This Library Carpentry lesson introduces people with library- and information-related roles to working with data using regular expressions. The lesson provides background on the regular expression language and how it can be used to match and extract text and to clean data.
Lesson on OpenRefine for social scientists. A part of the data workflow …
Lesson on OpenRefine for social scientists. A part of the data workflow is preparing the data for analysis. Some of this involves data cleaning, where errors in the data are identifed and corrected or formatting made consistent. This step must be taken with the same care and attention to reproducibility as the analysis. OpenRefine (formerly Google Refine) is a powerful free and open source tool for working with messy data: cleaning it and transforming it from one format into another. This lesson will teach you to use OpenRefine to effectively clean and format data and automatically track any changes that you make. Many people comment that this tool saves them literally months of work trying to make these edits by hand.
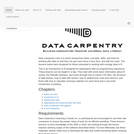
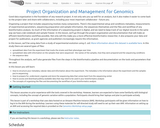
Data Carpentry Genomics workshop lesson to learn how to structure your metadata, …
Data Carpentry Genomics workshop lesson to learn how to structure your metadata, organize and document your genomics data and bioinformatics workflow, and access data on the NCBI sequence read archive (SRA) database. Good data organization is the foundation of any research project. It not only sets you up well for an analysis, but it also makes it easier to come back to the project later and share with collaborators, including your most important collaborator - future you. Organizing a project that includes sequencing involves many components. There’s the experimental setup and conditions metadata, measurements of experimental parameters, sequencing preparation and sample information, the sequences themselves and the files and workflow of any bioinformatics analysis. So much of the information of a sequencing project is digital, and we need to keep track of our digital records in the same way we have a lab notebook and sample freezer. In this lesson, we’ll go through the project organization and documentation that will make an efficient bioinformatics workflow possible. Not only will this make you a more effective bioinformatics researcher, it also prepares your data and project for publication, as grant agencies and publishers increasingly require this information. In this lesson, we’ll be using data from a study of experimental evolution using E. coli. More information about this dataset is available here. In this study there are several types of files: Spreadsheet data from the experiment that tracks the strains and their phenotype over time Spreadsheet data with information on the samples that were sequenced - the names of the samples, how they were prepared and the sequencing conditions The sequence data Throughout the analysis, we’ll also generate files from the steps in the bioinformatics pipeline and documentation on the tools and parameters that we used. In this lesson you will learn: How to structure your metadata, tabular data and information about the experiment. The metadata is the information about the experiment and the samples you’re sequencing. How to prepare for, understand, organize and store the sequencing data that comes back from the sequencing center How to access and download publicly available data that may need to be used in your bioinformatics analysis The concepts of organizing the files and documenting the workflow of your bioinformatics analysis
Workshop goals - Why are we teaching this - Why is this …
Workshop goals - Why are we teaching this - Why is this important - For future and current you - For research as a whole - Lack of reproducibility in research is a real problem
Materials and how we'll use them - Workshop landing page, with
- links to the Materials - schedule
Structure oriented along the Four Facets of Reproducibility:
How this workshop is run - This is a Carpentries Workshop - that means friendly learning environment - Code of Conduct - active learning - work with the people next to you - ask for help
This lesson in part of Software Carpentry workshop and teach novice programmers …
This lesson in part of Software Carpentry workshop and teach novice programmers to write modular code and best practices for using R for data analysis. an introduction to R for non-programmers using gapminder data The goal of this lesson is to teach novice programmers to write modular code and best practices for using R for data analysis. R is commonly used in many scientific disciplines for statistical analysis and its array of third-party packages. We find that many scientists who come to Software Carpentry workshops use R and want to learn more. The emphasis of these materials is to give attendees a strong foundation in the fundamentals of R, and to teach best practices for scientific computing: breaking down analyses into modular units, task automation, and encapsulation. Note that this workshop will focus on teaching the fundamentals of the programming language R, and will not teach statistical analysis. The lesson contains more material than can be taught in a day. The instructor notes page has some suggested lesson plans suitable for a one or half day workshop. A variety of third party packages are used throughout this workshop. These are not necessarily the best, nor are they comprehensive, but they are packages we find useful, and have been chosen primarily for their usability.
Una introducción a R utilizando los datos de Gapminder. El objetivo de …
Una introducción a R utilizando los datos de Gapminder. El objetivo de esta lección es enseñar a las programadoras principiantes a escribir códigos modulares y adoptar buenas prácticas en el uso de R para el análisis de datos. R nos provee un conjunto de paquetes desarrollados por terceros que se usan comúnmente en diversas disciplinas científicas para el análisis estadístico. Encontramos que muchos científicos que asisten a los talleres de Software Carpentry utilizan R y quieren aprender más. Nuestros materiales son relevantes ya que proporcionan a los asistentes una base sólida en los fundamentos de R y enseñan las mejores prácticas del cómputo científico: desglose del análisis en módulos, automatización tareas y encapsulamiento. Ten en cuenta que este taller se enfoca en los fundamentos del lenguaje de programación R y no en el análisis estadístico. A lo largo de este taller se utilizan una variedad de paquetes desarrolados por terceros, los cuales no son necesariamente los mejores ni se encuentran explicadas todas sus funcionalidades, pero son paquetes que consideramos útiles y han sido elegidos principalmente por su facilidad de uso.
Software Carpentry lesson on how to use the shell to navigate the …
Software Carpentry lesson on how to use the shell to navigate the filesystem and write simple loops and scripts. The Unix shell has been around longer than most of its users have been alive. It has survived so long because it’s a power tool that allows people to do complex things with just a few keystrokes. More importantly, it helps them combine existing programs in new ways and automate repetitive tasks so they aren’t typing the same things over and over again. Use of the shell is fundamental to using a wide range of other powerful tools and computing resources (including “high-performance computing†supercomputers). These lessons will start you on a path towards using these resources effectively.
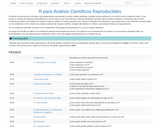
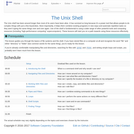
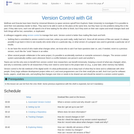
This lesson is part of the Software Carpentry workshops that teach how …
This lesson is part of the Software Carpentry workshops that teach how to use version control with Git. Wolfman and Dracula have been hired by Universal Missions (a space services spinoff from Euphoric State University) to investigate if it is possible to send their next planetary lander to Mars. They want to be able to work on the plans at the same time, but they have run into problems doing this in the past. If they take turns, each one will spend a lot of time waiting for the other to finish, but if they work on their own copies and email changes back and forth things will be lost, overwritten, or duplicated. A colleague suggests using version control to manage their work. Version control is better than mailing files back and forth: Nothing that is committed to version control is ever lost, unless you work really, really hard at it. Since all old versions of files are saved, it’s always possible to go back in time to see exactly who wrote what on a particular day, or what version of a program was used to generate a particular set of results. As we have this record of who made what changes when, we know who to ask if we have questions later on, and, if needed, revert to a previous version, much like the “undo†feature in an editor. When several people collaborate in the same project, it’s possible to accidentally overlook or overwrite someone’s changes. The version control system automatically notifies users whenever there’s a conflict between one person’s work and another’s. Teams are not the only ones to benefit from version control: lone researchers can benefit immensely. Keeping a record of what was changed, when, and why is extremely useful for all researchers if they ever need to come back to the project later on (e.g., a year later, when memory has faded). Version control is the lab notebook of the digital world: it’s what professionals use to keep track of what they’ve done and to collaborate with other people. Every large software development project relies on it, and most programmers use it for their small jobs as well. And it isn’t just for software: books, papers, small data sets, and anything that changes over time or needs to be shared can and should be stored in a version control system.
No restrictions on your remixing, redistributing, or making derivative works. Give credit to the author, as required.
Your remixing, redistributing, or making derivatives works comes with some restrictions, including how it is shared.
Your redistributing comes with some restrictions. Do not remix or make derivative works.
Most restrictive license type. Prohibits most uses, sharing, and any changes.
Copyrighted materials, available under Fair Use and the TEACH Act for US-based educators, or other custom arrangements. Go to the resource provider to see their individual restrictions.